Slovene vs Immigrants from Western Africa Married-couple Households
COMPARE
Slovene
Immigrants from Western Africa
Married-couple Households
Married-couple Households Comparison
Slovenes
Immigrants from Western Africa
47.1%
MARRIED-COUPLE HOUSEHOLDS
81.7/ 100
METRIC RATING
145th/ 347
METRIC RANK
41.4%
MARRIED-COUPLE HOUSEHOLDS
0.0/ 100
METRIC RATING
307th/ 347
METRIC RANK
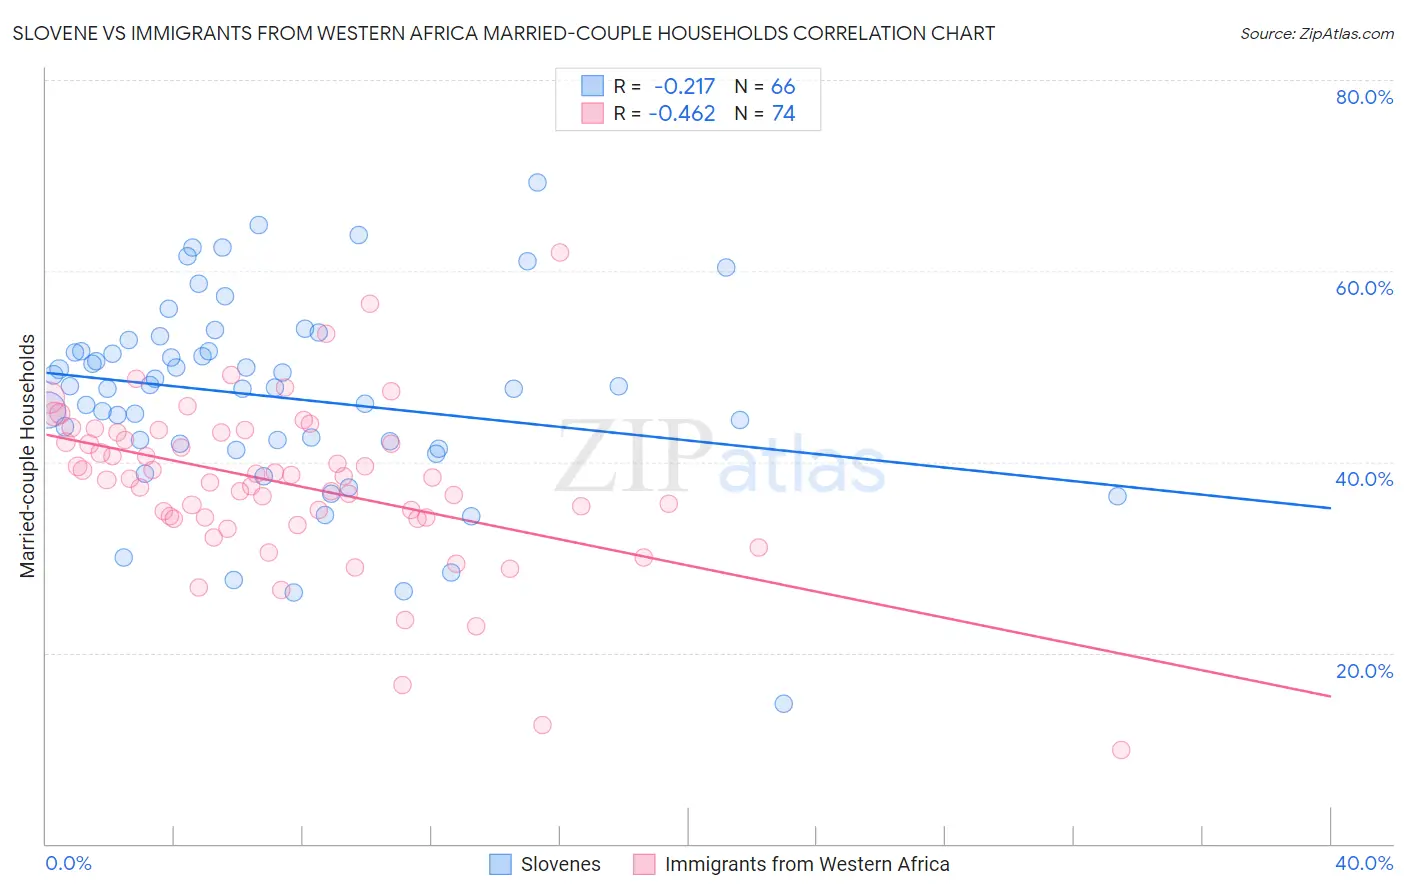
Slovene vs Immigrants from Western Africa Married-couple Households Correlation Chart
The statistical analysis conducted on geographies consisting of 261,254,206 people shows a weak negative correlation between the proportion of Slovenes and percentage of married-couple family households in the United States with a correlation coefficient (R) of -0.217 and weighted average of 47.1%. Similarly, the statistical analysis conducted on geographies consisting of 357,444,819 people shows a moderate negative correlation between the proportion of Immigrants from Western Africa and percentage of married-couple family households in the United States with a correlation coefficient (R) of -0.462 and weighted average of 41.4%, a difference of 13.9%.
Married-couple Households Correlation Summary
| Measurement | Slovene | Immigrants from Western Africa |
| Minimum | 14.6% | 9.9% |
| Maximum | 69.2% | 61.9% |
| Range | 54.6% | 52.0% |
| Mean | 46.8% | 37.7% |
| Median | 47.8% | 38.4% |
| Interquartile 25% (IQ1) | 41.8% | 34.2% |
| Interquartile 75% (IQ3) | 51.6% | 43.0% |
| Interquartile Range (IQR) | 9.7% | 8.9% |
| Standard Deviation (Sample) | 10.2% | 8.6% |
| Standard Deviation (Population) | 10.1% | 8.5% |
Similar Demographics by Married-couple Households
Demographics Similar to Slovenes by Married-couple Households
In terms of married-couple households, the demographic groups most similar to Slovenes are Immigrants from Western Europe (47.1%, a difference of 0.0%), Immigrants from Syria (47.1%, a difference of 0.010%), Mexican (47.1%, a difference of 0.11%), Icelander (47.0%, a difference of 0.13%), and Immigrants from Belarus (47.2%, a difference of 0.14%).
| Demographics | Rating | Rank | Married-couple Households |
| Immigrants | Afghanistan | 85.1 /100 | #138 | Excellent 47.2% |
| Immigrants | Sweden | 84.7 /100 | #139 | Excellent 47.2% |
| Spanish | 84.5 /100 | #140 | Excellent 47.2% |
| Costa Ricans | 84.4 /100 | #141 | Excellent 47.2% |
| Spaniards | 84.1 /100 | #142 | Excellent 47.2% |
| Immigrants | Belarus | 83.8 /100 | #143 | Excellent 47.2% |
| Mexicans | 83.4 /100 | #144 | Excellent 47.1% |
| Slovenes | 81.7 /100 | #145 | Excellent 47.1% |
| Immigrants | Western Europe | 81.6 /100 | #146 | Excellent 47.1% |
| Immigrants | Syria | 81.6 /100 | #147 | Excellent 47.1% |
| Icelanders | 79.5 /100 | #148 | Good 47.0% |
| Paraguayans | 78.7 /100 | #149 | Good 47.0% |
| Immigrants | Russia | 77.6 /100 | #150 | Good 47.0% |
| Immigrants | Bulgaria | 76.8 /100 | #151 | Good 47.0% |
| Serbians | 76.3 /100 | #152 | Good 47.0% |
Demographics Similar to Immigrants from Western Africa by Married-couple Households
In terms of married-couple households, the demographic groups most similar to Immigrants from Western Africa are Guyanese (41.4%, a difference of 0.010%), Crow (41.4%, a difference of 0.010%), Immigrants from Trinidad and Tobago (41.2%, a difference of 0.36%), Sioux (41.5%, a difference of 0.38%), and Haitian (41.2%, a difference of 0.43%).
| Demographics | Rating | Rank | Married-couple Households |
| Immigrants | Belize | 0.0 /100 | #300 | Tragic 41.8% |
| Immigrants | Bahamas | 0.0 /100 | #301 | Tragic 41.7% |
| Immigrants | Honduras | 0.0 /100 | #302 | Tragic 41.6% |
| Sub-Saharan Africans | 0.0 /100 | #303 | Tragic 41.6% |
| Immigrants | Guyana | 0.0 /100 | #304 | Tragic 41.6% |
| Sioux | 0.0 /100 | #305 | Tragic 41.5% |
| Guyanese | 0.0 /100 | #306 | Tragic 41.4% |
| Immigrants | Western Africa | 0.0 /100 | #307 | Tragic 41.4% |
| Crow | 0.0 /100 | #308 | Tragic 41.4% |
| Immigrants | Trinidad and Tobago | 0.0 /100 | #309 | Tragic 41.2% |
| Haitians | 0.0 /100 | #310 | Tragic 41.2% |
| Colville | 0.0 /100 | #311 | Tragic 41.0% |
| Africans | 0.0 /100 | #312 | Tragic 40.9% |
| Immigrants | Haiti | 0.0 /100 | #313 | Tragic 40.9% |
| Jamaicans | 0.0 /100 | #314 | Tragic 40.9% |