Slovak vs Bhutanese Family Households

COMPARE

Slovak
Race
Ancestry
AfghanAfricanAlaska NativeAlaskan AthabascanAlbanianAleutAlsatianAmericanApacheArabArapahoArgentineanArmenianAssyrian/Chaldean/SyriacAustralianAustrianBahamianBangladeshiBarbadianBasqueBelgianBelizeanBermudanBlackfeetBolivianBrazilianBritishBritish West IndianBulgarianBurmeseCajunCambodianCanadianCape VerdeanCarpatho RusynCelticCentral AmericanCentral American IndianCherokeeCheyenneChickasawChileanChineseChippewaChoctawColombianColvilleComancheCosta RicanCreeCreekCroatianCrowCubanCypriotCzechCzechoslovakianDanishDelawareDominicanDutchDutch West IndianEastern EuropeanEcuadorianEgyptianEnglishEstonianEthiopianEuropeanFijianFilipinoFinnishFrenchFrench American IndianFrench CanadianGermanGerman RussianGhanaianGreekGuamanian/ChamorroGuatemalanGuyaneseHaitianHmongHonduranHopiHoumaHungarianIcelanderIndian (Asian)IndonesianInupiatIranianIraqiIrishIroquoisIsraeliItalianJamaicanJapaneseJordanianKenyanKiowaKoreanLaotianLatvianLebaneseLiberianLithuanianLumbeeLuxembourgerMacedonianMalaysianMalteseMarshalleseMenomineeMexicanMexican American IndianMongolianMoroccanNative HawaiianNavajoNepaleseNew ZealanderNicaraguanNigerianNorthern EuropeanNorwegianOkinawanOsageOttawaPaiutePakistaniPalestinianPanamanianParaguayanPennsylvania GermanPeruvianPimaPolishPortuguesePotawatomiPuebloPuerto RicanPuget Sound SalishRomanianRussianSalvadoranSamoanScandinavianScotch-IrishScottishSeminoleSenegaleseSerbianShoshoneSierra LeoneanSiouxSlavicSlovakSloveneSomaliSouth AfricanSouth AmericanSouth American IndianSoviet UnionSpaniardSpanishSpanish AmericanSpanish American IndianSri LankanSubsaharan AfricanSudaneseSwedishSwissSyrianTaiwaneseThaiTlingit-HaidaTohono O'OdhamTonganTrinidadian and TobagonianTsimshianTurkishU.S. Virgin IslanderUgandanUkrainianUruguayanUteVenezuelanVietnameseWelshWest IndianYakamaYaquiYugoslavianYumanYup'ikZimbabwean
Immigration
NonimmigrantsImmigrantsAfghanistanAfricaAlbaniaArgentinaArmeniaAsiaAustraliaAustriaBahamasBangladeshBarbadosBelarusBelgiumBelizeBoliviaBosnia and HerzegovinaBrazilBulgariaBurma/MyanmarCabo VerdeCambodiaCameroonCanadaCaribbeanCentral AmericaChileChinaColombiaCongoCosta RicaCroatiaCubaCzechoslovakiaDenmarkDominicaDominican RepublicEastern AfricaEastern AsiaEastern EuropeEcuadorEgyptEl SalvadorEnglandEritreaEthiopiaEuropeFijiFranceGermanyGhanaGreeceGrenadaGuatemalaGuyanaHaitiHondurasHong KongHungaryIndiaIndonesiaIranIraqIrelandIsraelItalyJamaicaJapanJordanKazakhstanKenyaKoreaKuwaitLaosLatin AmericaLatviaLebanonLiberiaLithuaniaMalaysiaMexicoMicronesiaMiddle AfricaMoldovaMoroccoNepalNetherlandsNicaraguaNigeriaNorth AmericaNorth MacedoniaNorthern AfricaNorthern EuropeNorwayOceaniaPakistanPanamaPeruPhilippinesPolandPortugalRomaniaRussiaSaudi ArabiaScotlandSenegalSerbiaSierra LeoneSingaporeSomaliaSouth AfricaSouth AmericaSouth Central AsiaSouth Eastern AsiaSouthern EuropeSpainSri LankaSt. Vincent and the GrenadinesSudanSwedenSwitzerlandSyriaTaiwanThailandTrinidad and TobagoTurkeyUgandaUkraineUruguayUzbekistanVenezuelaVietnamWest IndiesWestern AfricaWestern AsiaWestern EuropeYemenZaireZimbabweAzores
Bhutanese
Race
Ancestry
AfghanAfricanAlaska NativeAlaskan AthabascanAlbanianAleutAlsatianAmericanApacheArabArapahoArgentineanArmenianAssyrian/Chaldean/SyriacAustralianAustrianBahamianBangladeshiBarbadianBasqueBelgianBelizeanBermudanBhutaneseBlackfeetBolivianBrazilianBritishBritish West IndianBulgarianBurmeseCajunCambodianCanadianCape VerdeanCarpatho RusynCelticCentral AmericanCentral American IndianCherokeeCheyenneChickasawChileanChineseChippewaChoctawColombianColvilleComancheCosta RicanCreeCreekCroatianCrowCubanCypriotCzechCzechoslovakianDanishDelawareDominicanDutchDutch West IndianEastern EuropeanEcuadorianEgyptianEnglishEstonianEthiopianEuropeanFijianFilipinoFinnishFrenchFrench American IndianFrench CanadianGermanGerman RussianGhanaianGreekGuamanian/ChamorroGuatemalanGuyaneseHaitianHmongHonduranHopiHoumaHungarianIcelanderIndian (Asian)IndonesianInupiatIranianIraqiIrishIroquoisIsraeliItalianJamaicanJapaneseJordanianKenyanKiowaKoreanLaotianLatvianLebaneseLiberianLithuanianLumbeeLuxembourgerMacedonianMalaysianMalteseMarshalleseMenomineeMexicanMexican American IndianMongolianMoroccanNative HawaiianNavajoNepaleseNew ZealanderNicaraguanNigerianNorthern EuropeanNorwegianOkinawanOsageOttawaPaiutePakistaniPalestinianPanamanianParaguayanPennsylvania GermanPeruvianPimaPolishPortuguesePotawatomiPuebloPuerto RicanPuget Sound SalishRomanianRussianSalvadoranSamoanScandinavianScotch-IrishScottishSeminoleSenegaleseSerbianShoshoneSierra LeoneanSiouxSlavicSloveneSomaliSouth AfricanSouth AmericanSouth American IndianSoviet UnionSpaniardSpanishSpanish AmericanSpanish American IndianSri LankanSubsaharan AfricanSudaneseSwedishSwissSyrianTaiwaneseThaiTlingit-HaidaTohono O'OdhamTonganTrinidadian and TobagonianTsimshianTurkishU.S. Virgin IslanderUgandanUkrainianUruguayanUteVenezuelanVietnameseWelshWest IndianYakamaYaquiYugoslavianYumanYup'ikZimbabwean
Immigration
NonimmigrantsImmigrantsAfghanistanAfricaAlbaniaArgentinaArmeniaAsiaAustraliaAustriaBahamasBangladeshBarbadosBelarusBelgiumBelizeBoliviaBosnia and HerzegovinaBrazilBulgariaBurma/MyanmarCabo VerdeCambodiaCameroonCanadaCaribbeanCentral AmericaChileChinaColombiaCongoCosta RicaCroatiaCubaCzechoslovakiaDenmarkDominicaDominican RepublicEastern AfricaEastern AsiaEastern EuropeEcuadorEgyptEl SalvadorEnglandEritreaEthiopiaEuropeFijiFranceGermanyGhanaGreeceGrenadaGuatemalaGuyanaHaitiHondurasHong KongHungaryIndiaIndonesiaIranIraqIrelandIsraelItalyJamaicaJapanJordanKazakhstanKenyaKoreaKuwaitLaosLatin AmericaLatviaLebanonLiberiaLithuaniaMalaysiaMexicoMicronesiaMiddle AfricaMoldovaMoroccoNepalNetherlandsNicaraguaNigeriaNorth AmericaNorth MacedoniaNorthern AfricaNorthern EuropeNorwayOceaniaPakistanPanamaPeruPhilippinesPolandPortugalRomaniaRussiaSaudi ArabiaScotlandSenegalSerbiaSierra LeoneSingaporeSomaliaSouth AfricaSouth AmericaSouth Central AsiaSouth Eastern AsiaSouthern EuropeSpainSri LankaSt. Vincent and the GrenadinesSudanSwedenSwitzerlandSyriaTaiwanThailandTrinidad and TobagoTurkeyUgandaUkraineUruguayUzbekistanVenezuelaVietnamWest IndiesWestern AfricaWestern AsiaWestern EuropeYemenZaireZimbabweAzores
Family Households
Income
Poverty
Unemployment
Labor Participation
Family Structure
Vehicle Availability
Education Level
Disability

Family Households Comparison

Slovaks

Bhutanese

Tragic
Exceptional
63.3%
FAMILY HOUSEHOLDS
1.0/ 100
METRIC RATING
254th/ 347
METRIC RANK
65.9%
FAMILY HOUSEHOLDS
99.9/ 100
METRIC RATING
71st/ 347
METRIC RANK

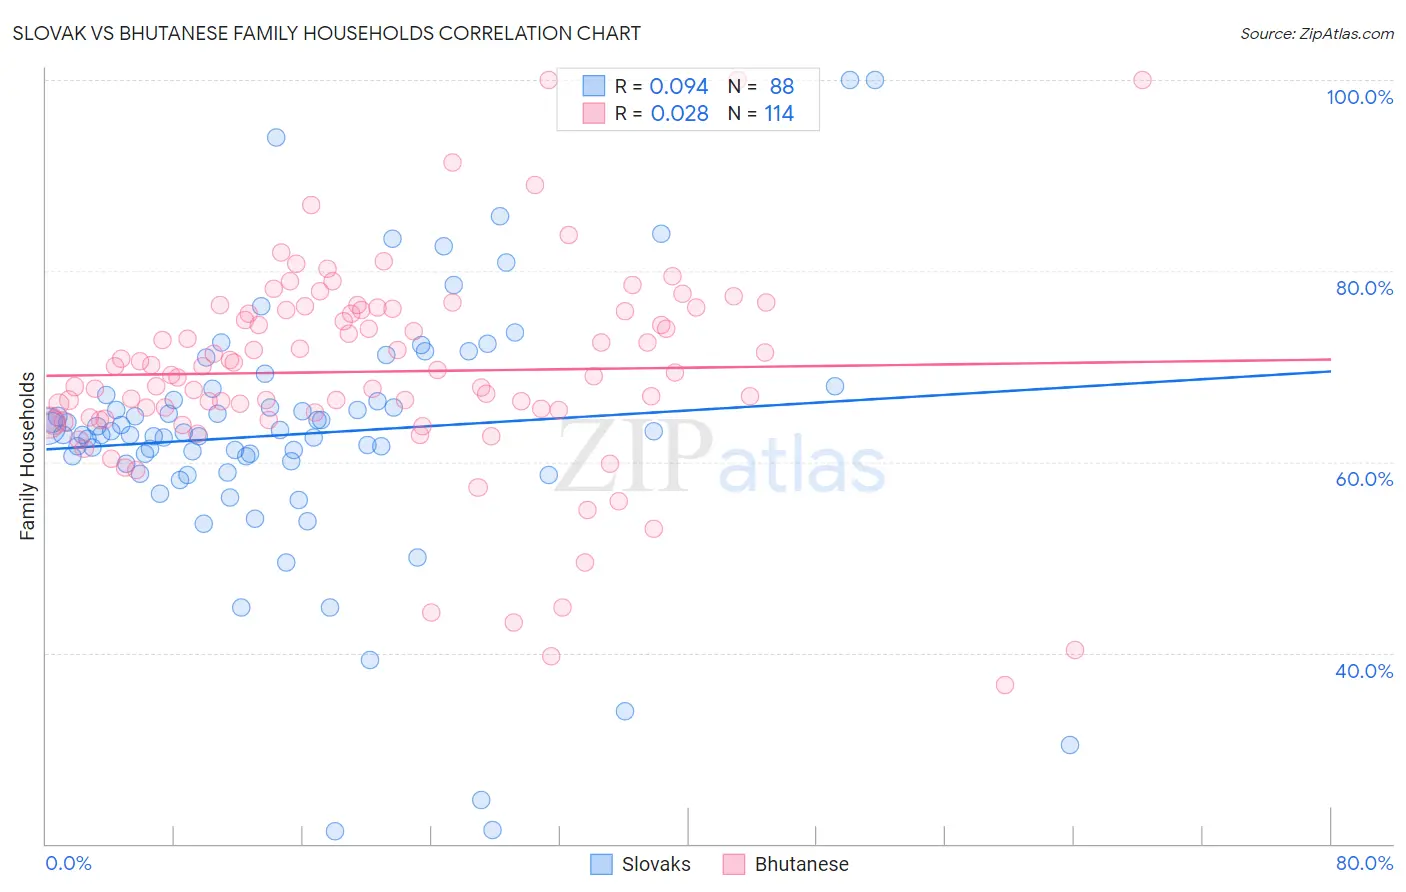
Slovak vs Bhutanese Family Households Correlation Chart

The statistical analysis conducted on geographies consisting of 397,683,029 people shows a slight positive correlation between the proportion of Slovaks and percentage of family households in the United States with a correlation coefficient (R) of 0.094 and weighted average of 63.3%. Similarly, the statistical analysis conducted on geographies consisting of 455,147,880 people shows no correlation between the proportion of Bhutanese and percentage of family households in the United States with a correlation coefficient (R) of 0.028 and weighted average of 65.9%, a difference of 4.0%.
Slovak vs Bhutanese Family Households

Family Households Correlation Summary

MeasurementSlovakBhutanese
Minimum21.3%36.6%
Maximum100.0%100.0%
Range78.7%63.4%
Mean62.9%69.5%
Median63.0%69.4%
Interquartile 25% (IQ1)59.9%64.7%
Interquartile 75% (IQ3)66.7%75.9%
Interquartile Range (IQR)6.8%11.2%
Standard Deviation (Sample)13.6%10.8%
Standard Deviation (Population)13.5%10.8%

Similar Demographics by Family Households

Demographics Similar to Slovaks by Family Households

In terms of family households, the demographic groups most similar to Slovaks are Immigrants from Dominican Republic (63.3%, a difference of 0.010%), Potawatomi (63.3%, a difference of 0.020%), Bahamian (63.3%, a difference of 0.030%), Taiwanese (63.3%, a difference of 0.040%), and Luxembourger (63.3%, a difference of 0.050%).
DemographicsRating | RankFamily Households
Immigrants | Uzbekistan
1.5
/100
|
#247
Tragic
63.4%
Dominicans
1.5
/100
|
#248
Tragic
63.4%
Russians
1.4
/100
|
#249
Tragic
63.4%
Immigrants | Japan
1.4
/100
|
#250
Tragic
63.4%
Taiwanese
1.2
/100
|
#251
Tragic
63.3%
Bahamians
1.1
/100
|
#252
Tragic
63.3%
Immigrants | Dominican Republic
1.0
/100
|
#253
Tragic
63.3%
Slovaks
1.0
/100
|
#254
Tragic
63.3%
Potawatomi
1.0
/100
|
#255
Tragic
63.3%
Luxembourgers
0.9
/100
|
#256
Tragic
63.3%
Icelanders
0.8
/100
|
#257
Tragic
63.3%
Immigrants | Barbados
0.7
/100
|
#258
Tragic
63.2%
Immigrants | Western Europe
0.6
/100
|
#259
Tragic
63.2%
Cypriots
0.6
/100
|
#260
Tragic
63.2%
Immigrants | Russia
0.6
/100
|
#261
Tragic
63.2%

Demographics Similar to Bhutanese by Family Households

In terms of family households, the demographic groups most similar to Bhutanese are Malaysian (65.9%, a difference of 0.020%), Immigrants from Afghanistan (65.9%, a difference of 0.020%), Portuguese (65.8%, a difference of 0.050%), Japanese (65.9%, a difference of 0.060%), and Fijian (65.9%, a difference of 0.080%).
DemographicsRating | RankFamily Households
Pima
99.9
/100
|
#64
Exceptional
65.9%
Costa Ricans
99.9
/100
|
#65
Exceptional
65.9%
Fijians
99.9
/100
|
#66
Exceptional
65.9%
Filipinos
99.9
/100
|
#67
Exceptional
65.9%
Japanese
99.9
/100
|
#68
Exceptional
65.9%
Malaysians
99.9
/100
|
#69
Exceptional
65.9%
Immigrants | Afghanistan
99.9
/100
|
#70
Exceptional
65.9%
Bhutanese
99.9
/100
|
#71
Exceptional
65.9%
Portuguese
99.9
/100
|
#72
Exceptional
65.8%
Laotians
99.9
/100
|
#73
Exceptional
65.8%
Burmese
99.9
/100
|
#74
Exceptional
65.7%
Houma
99.9
/100
|
#75
Exceptional
65.7%
Immigrants | Azores
99.8
/100
|
#76
Exceptional
65.6%
Immigrants | South America
99.8
/100
|
#77
Exceptional
65.6%
Yaqui
99.8
/100
|
#78
Exceptional
65.6%