Immigrants from Africa vs Immigrants from France Married-couple Households
COMPARE
Immigrants from Africa
Immigrants from France
Married-couple Households
Married-couple Households Comparison
Immigrants from Africa
Immigrants from France
42.9%
MARRIED-COUPLE HOUSEHOLDS
0.0/ 100
METRIC RATING
278th/ 347
METRIC RANK
45.4%
MARRIED-COUPLE HOUSEHOLDS
8.8/ 100
METRIC RATING
207th/ 347
METRIC RANK
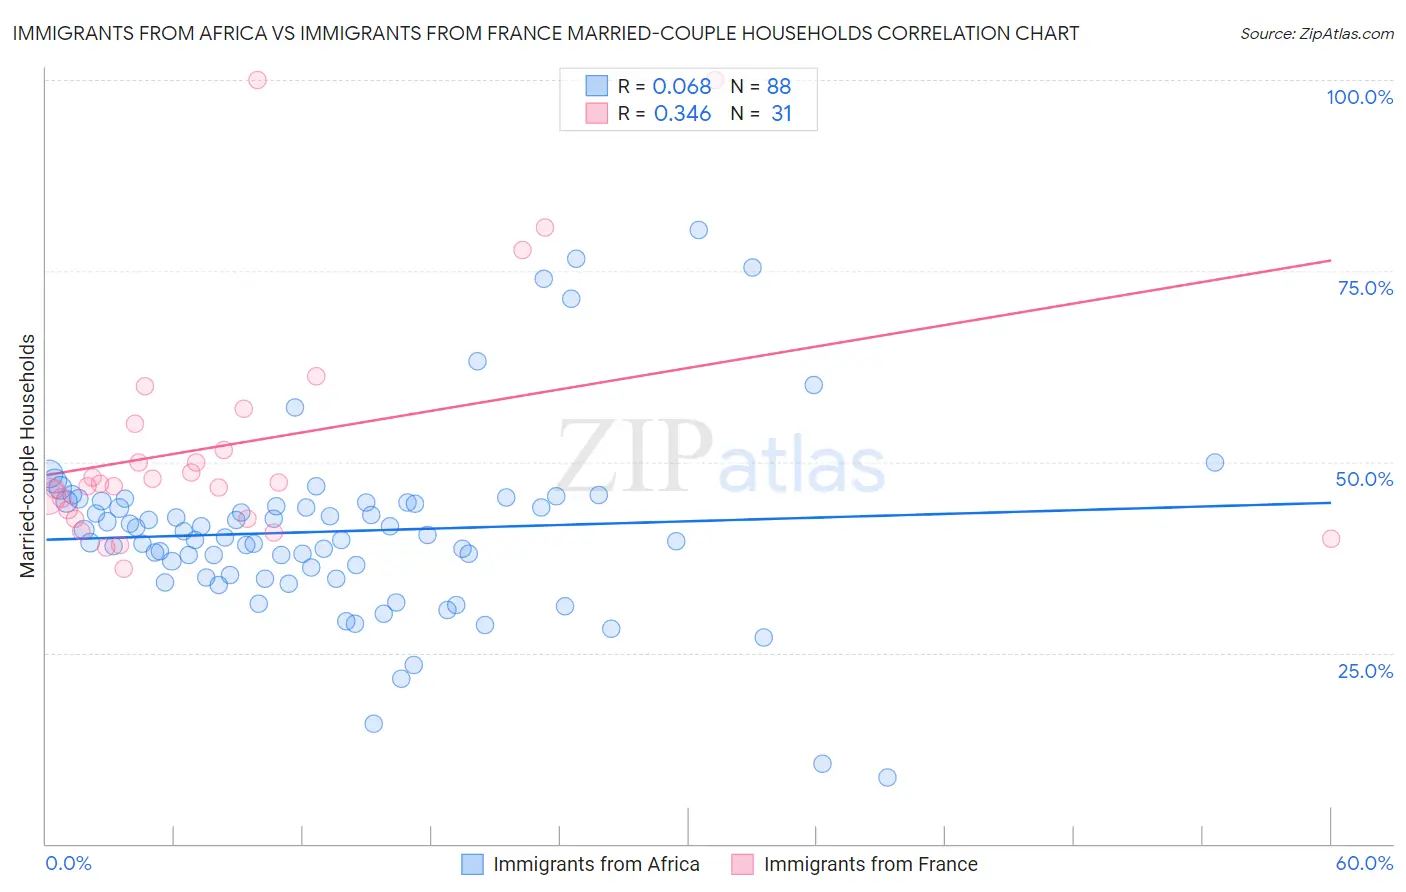
Immigrants from Africa vs Immigrants from France Married-couple Households Correlation Chart
The statistical analysis conducted on geographies consisting of 468,925,641 people shows a slight positive correlation between the proportion of Immigrants from Africa and percentage of married-couple family households in the United States with a correlation coefficient (R) of 0.068 and weighted average of 42.9%. Similarly, the statistical analysis conducted on geographies consisting of 287,855,925 people shows a mild positive correlation between the proportion of Immigrants from France and percentage of married-couple family households in the United States with a correlation coefficient (R) of 0.346 and weighted average of 45.4%, a difference of 5.9%.
Married-couple Households Correlation Summary
| Measurement | Immigrants from Africa | Immigrants from France |
| Minimum | 8.7% | 36.1% |
| Maximum | 80.4% | 100.0% |
| Range | 71.7% | 63.9% |
| Mean | 40.9% | 52.4% |
| Median | 40.3% | 47.2% |
| Interquartile 25% (IQ1) | 35.0% | 42.6% |
| Interquartile 75% (IQ3) | 44.7% | 54.9% |
| Interquartile Range (IQR) | 9.7% | 12.3% |
| Standard Deviation (Sample) | 12.1% | 16.1% |
| Standard Deviation (Population) | 12.1% | 15.9% |
Similar Demographics by Married-couple Households
Demographics Similar to Immigrants from Africa by Married-couple Households
In terms of married-couple households, the demographic groups most similar to Immigrants from Africa are Sierra Leonean (42.9%, a difference of 0.030%), Immigrants from Ecuador (42.9%, a difference of 0.080%), Immigrants from Eastern Africa (42.9%, a difference of 0.11%), Immigrants from Guatemala (42.8%, a difference of 0.16%), and Immigrants from Ethiopia (43.1%, a difference of 0.36%).
| Demographics | Rating | Rank | Married-couple Households |
| Guatemalans | 0.1 /100 | #271 | Tragic 43.3% |
| Immigrants | Nigeria | 0.1 /100 | #272 | Tragic 43.2% |
| Ethiopians | 0.1 /100 | #273 | Tragic 43.2% |
| Nigerians | 0.1 /100 | #274 | Tragic 43.2% |
| Immigrants | Bangladesh | 0.0 /100 | #275 | Tragic 43.1% |
| Immigrants | Ethiopia | 0.0 /100 | #276 | Tragic 43.1% |
| Immigrants | Eastern Africa | 0.0 /100 | #277 | Tragic 42.9% |
| Immigrants | Africa | 0.0 /100 | #278 | Tragic 42.9% |
| Sierra Leoneans | 0.0 /100 | #279 | Tragic 42.9% |
| Immigrants | Ecuador | 0.0 /100 | #280 | Tragic 42.9% |
| Immigrants | Guatemala | 0.0 /100 | #281 | Tragic 42.8% |
| Bermudans | 0.0 /100 | #282 | Tragic 42.4% |
| Inupiat | 0.0 /100 | #283 | Tragic 42.4% |
| Cheyenne | 0.0 /100 | #284 | Tragic 42.3% |
| Ghanaians | 0.0 /100 | #285 | Tragic 42.2% |
Demographics Similar to Immigrants from France by Married-couple Households
In terms of married-couple households, the demographic groups most similar to Immigrants from France are Hispanic or Latino (45.4%, a difference of 0.010%), Immigrants from Uzbekistan (45.4%, a difference of 0.050%), Cuban (45.4%, a difference of 0.14%), Uruguayan (45.5%, a difference of 0.18%), and Immigrants from Spain (45.3%, a difference of 0.19%).
| Demographics | Rating | Rank | Married-couple Households |
| Potawatomi | 15.6 /100 | #200 | Poor 45.7% |
| Immigrants | Serbia | 15.2 /100 | #201 | Poor 45.7% |
| Immigrants | Central America | 14.2 /100 | #202 | Poor 45.7% |
| Alaska Natives | 13.0 /100 | #203 | Poor 45.6% |
| Aleuts | 12.5 /100 | #204 | Poor 45.6% |
| Nepalese | 11.9 /100 | #205 | Poor 45.6% |
| Uruguayans | 10.4 /100 | #206 | Poor 45.5% |
| Immigrants | France | 8.8 /100 | #207 | Tragic 45.4% |
| Hispanics or Latinos | 8.7 /100 | #208 | Tragic 45.4% |
| Immigrants | Uzbekistan | 8.4 /100 | #209 | Tragic 45.4% |
| Cubans | 7.7 /100 | #210 | Tragic 45.4% |
| Immigrants | Spain | 7.3 /100 | #211 | Tragic 45.3% |
| Creek | 6.4 /100 | #212 | Tragic 45.3% |
| Yakama | 5.8 /100 | #213 | Tragic 45.2% |
| Japanese | 5.7 /100 | #214 | Tragic 45.2% |