Slovak vs Hungarian Divorced or Separated
COMPARE
Slovak
Hungarian
Divorced or Separated
Divorced or Separated Comparison
Slovaks
Hungarians
12.2%
DIVORCED OR SEPARATED
21.0/ 100
METRIC RATING
206th/ 347
METRIC RANK
12.0%
DIVORCED OR SEPARATED
70.3/ 100
METRIC RATING
156th/ 347
METRIC RANK
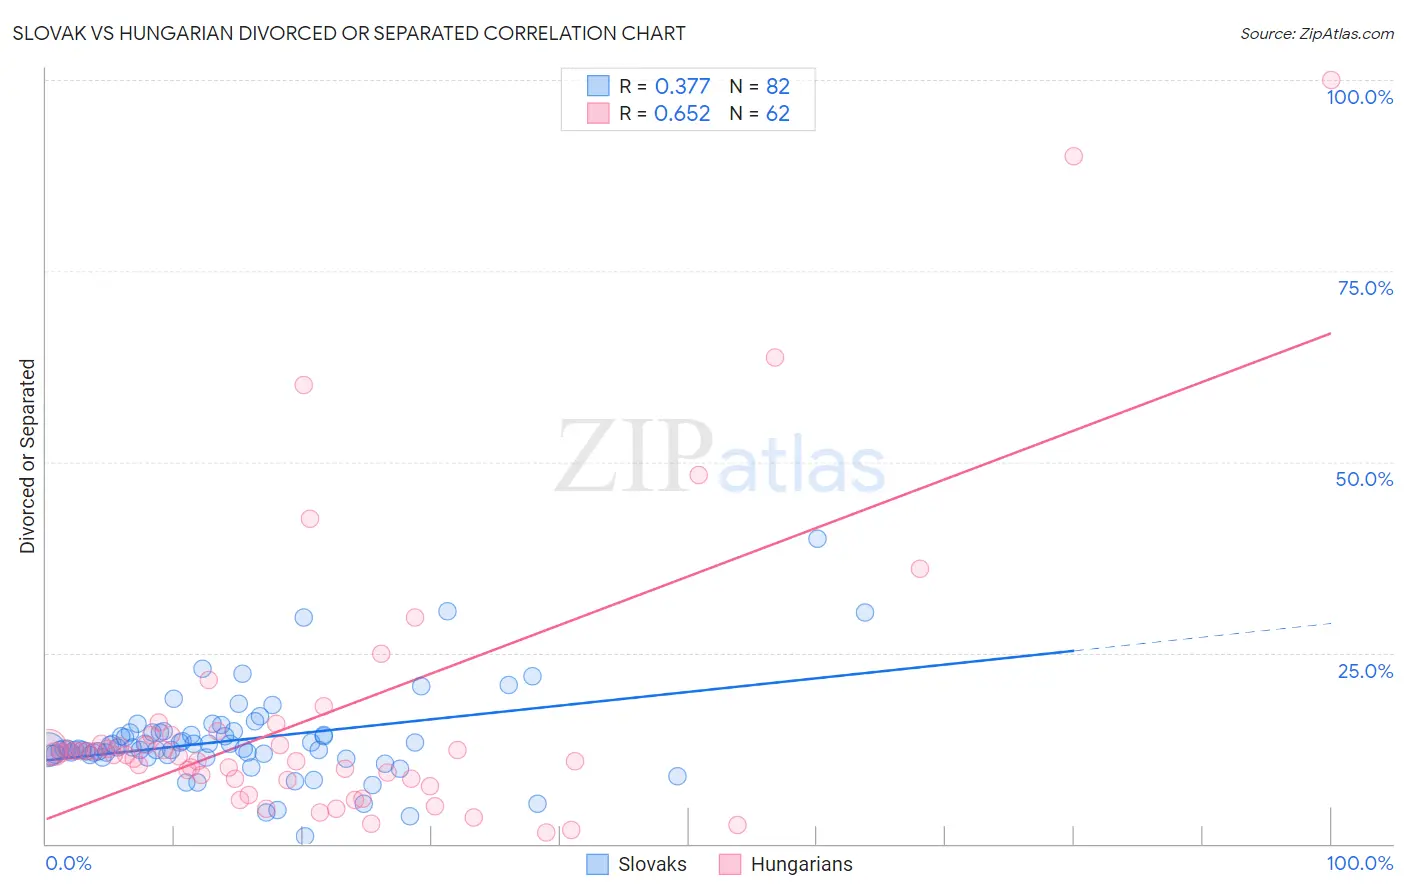
Slovak vs Hungarian Divorced or Separated Correlation Chart
The statistical analysis conducted on geographies consisting of 397,744,388 people shows a mild positive correlation between the proportion of Slovaks and percentage of population currently divorced or separated in the United States with a correlation coefficient (R) of 0.377 and weighted average of 12.2%. Similarly, the statistical analysis conducted on geographies consisting of 485,998,803 people shows a significant positive correlation between the proportion of Hungarians and percentage of population currently divorced or separated in the United States with a correlation coefficient (R) of 0.652 and weighted average of 12.0%, a difference of 1.9%.
Divorced or Separated Correlation Summary
| Measurement | Slovak | Hungarian |
| Minimum | 1.0% | 1.4% |
| Maximum | 40.0% | 100.0% |
| Range | 39.0% | 98.6% |
| Mean | 13.6% | 16.6% |
| Median | 12.4% | 11.7% |
| Interquartile 25% (IQ1) | 11.6% | 8.5% |
| Interquartile 75% (IQ3) | 14.6% | 14.2% |
| Interquartile Range (IQR) | 3.0% | 5.8% |
| Standard Deviation (Sample) | 5.9% | 19.0% |
| Standard Deviation (Population) | 5.9% | 18.8% |
Similar Demographics by Divorced or Separated
Demographics Similar to Slovaks by Divorced or Separated
In terms of divorced or separated, the demographic groups most similar to Slovaks are Mexican (12.2%, a difference of 0.0%), Immigrants from Costa Rica (12.2%, a difference of 0.010%), Kenyan (12.2%, a difference of 0.040%), Immigrants from Guatemala (12.2%, a difference of 0.11%), and Portuguese (12.2%, a difference of 0.12%).
| Demographics | Rating | Rank | Divorced or Separated |
| Central Americans | 29.4 /100 | #199 | Fair 12.1% |
| South Americans | 28.6 /100 | #200 | Fair 12.2% |
| Guatemalans | 26.9 /100 | #201 | Fair 12.2% |
| Portuguese | 23.5 /100 | #202 | Fair 12.2% |
| Immigrants | Guatemala | 23.2 /100 | #203 | Fair 12.2% |
| Kenyans | 21.8 /100 | #204 | Fair 12.2% |
| Immigrants | Costa Rica | 21.3 /100 | #205 | Fair 12.2% |
| Slovaks | 21.0 /100 | #206 | Fair 12.2% |
| Mexicans | 21.0 /100 | #207 | Fair 12.2% |
| Immigrants | Ghana | 18.8 /100 | #208 | Poor 12.2% |
| Immigrants | Trinidad and Tobago | 17.8 /100 | #209 | Poor 12.2% |
| Slavs | 17.0 /100 | #210 | Poor 12.2% |
| Trinidadians and Tobagonians | 16.6 /100 | #211 | Poor 12.2% |
| Immigrants | Kenya | 16.5 /100 | #212 | Poor 12.2% |
| Immigrants | Eastern Africa | 16.2 /100 | #213 | Poor 12.2% |
Demographics Similar to Hungarians by Divorced or Separated
In terms of divorced or separated, the demographic groups most similar to Hungarians are Japanese (12.0%, a difference of 0.020%), Chilean (12.0%, a difference of 0.040%), Immigrants from Brazil (12.0%, a difference of 0.060%), Austrian (12.0%, a difference of 0.080%), and Immigrants from Hungary (11.9%, a difference of 0.15%).
| Demographics | Rating | Rank | Divorced or Separated |
| Immigrants | Oceania | 77.7 /100 | #149 | Good 11.9% |
| Immigrants | Portugal | 77.3 /100 | #150 | Good 11.9% |
| Czechs | 76.4 /100 | #151 | Good 11.9% |
| Immigrants | Hungary | 73.7 /100 | #152 | Good 11.9% |
| Austrians | 72.2 /100 | #153 | Good 12.0% |
| Chileans | 71.3 /100 | #154 | Good 12.0% |
| Japanese | 70.9 /100 | #155 | Good 12.0% |
| Hungarians | 70.3 /100 | #156 | Good 12.0% |
| Immigrants | Brazil | 68.8 /100 | #157 | Good 12.0% |
| Icelanders | 66.0 /100 | #158 | Good 12.0% |
| Immigrants | Barbados | 66.0 /100 | #159 | Good 12.0% |
| Immigrants | Scotland | 65.8 /100 | #160 | Good 12.0% |
| Marshallese | 64.6 /100 | #161 | Good 12.0% |
| Samoans | 64.3 /100 | #162 | Good 12.0% |
| Navajo | 63.9 /100 | #163 | Good 12.0% |