Slovak vs Immigrants from Europe Divorced or Separated
COMPARE
Slovak
Immigrants from Europe
Divorced or Separated
Divorced or Separated Comparison
Slovaks
Immigrants from Europe
12.2%
DIVORCED OR SEPARATED
21.0/ 100
METRIC RATING
206th/ 347
METRIC RANK
11.6%
DIVORCED OR SEPARATED
99.2/ 100
METRIC RATING
88th/ 347
METRIC RANK
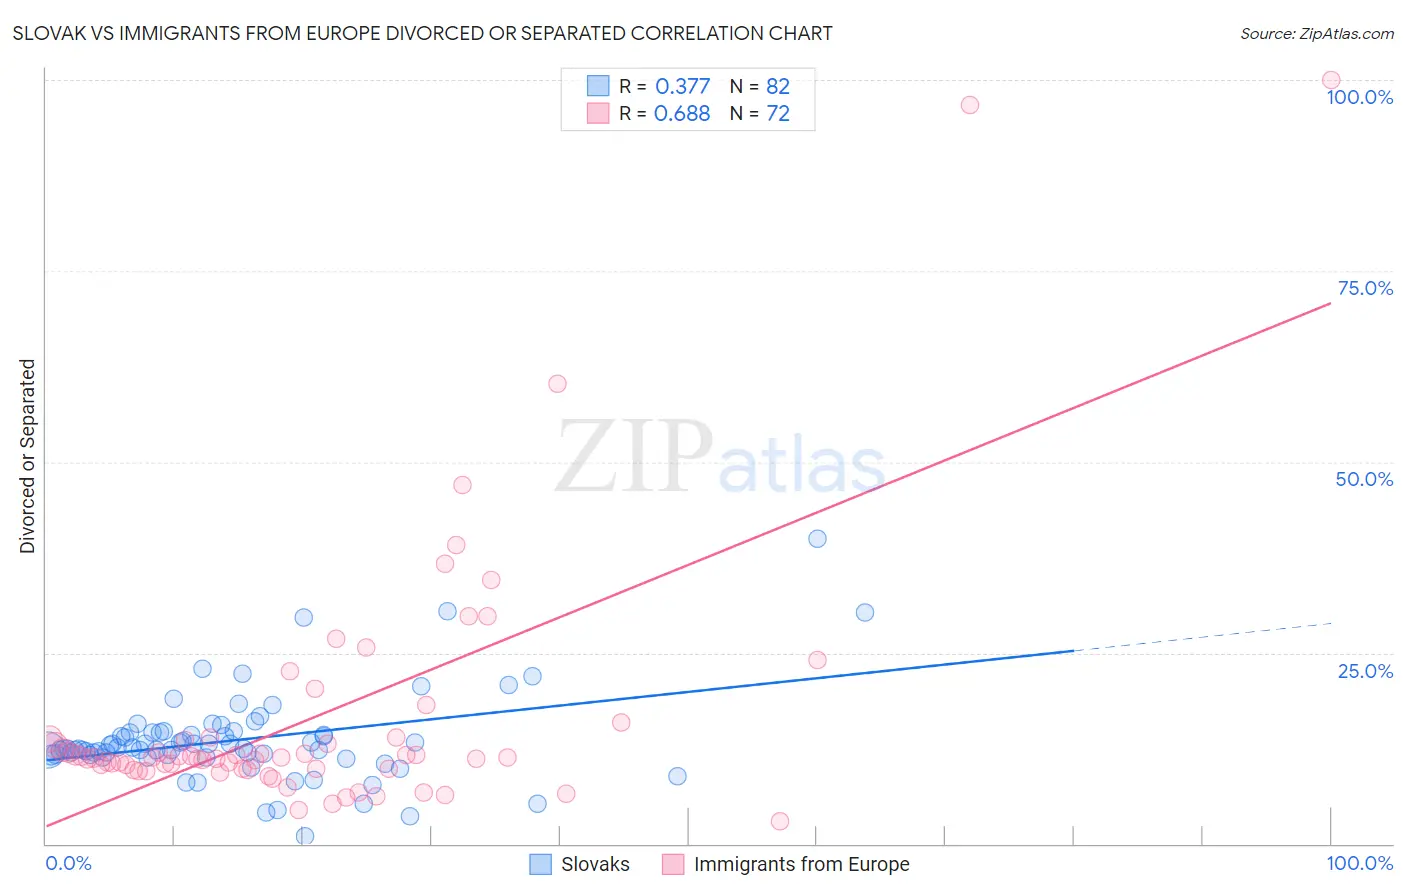
Slovak vs Immigrants from Europe Divorced or Separated Correlation Chart
The statistical analysis conducted on geographies consisting of 397,744,388 people shows a mild positive correlation between the proportion of Slovaks and percentage of population currently divorced or separated in the United States with a correlation coefficient (R) of 0.377 and weighted average of 12.2%. Similarly, the statistical analysis conducted on geographies consisting of 547,048,453 people shows a significant positive correlation between the proportion of Immigrants from Europe and percentage of population currently divorced or separated in the United States with a correlation coefficient (R) of 0.688 and weighted average of 11.6%, a difference of 5.5%.
Divorced or Separated Correlation Summary
| Measurement | Slovak | Immigrants from Europe |
| Minimum | 1.0% | 3.0% |
| Maximum | 40.0% | 100.0% |
| Range | 39.0% | 97.0% |
| Mean | 13.6% | 16.6% |
| Median | 12.4% | 11.3% |
| Interquartile 25% (IQ1) | 11.6% | 9.8% |
| Interquartile 75% (IQ3) | 14.6% | 13.8% |
| Interquartile Range (IQR) | 3.0% | 4.0% |
| Standard Deviation (Sample) | 5.9% | 17.1% |
| Standard Deviation (Population) | 5.9% | 17.0% |
Similar Demographics by Divorced or Separated
Demographics Similar to Slovaks by Divorced or Separated
In terms of divorced or separated, the demographic groups most similar to Slovaks are Mexican (12.2%, a difference of 0.0%), Immigrants from Costa Rica (12.2%, a difference of 0.010%), Kenyan (12.2%, a difference of 0.040%), Immigrants from Guatemala (12.2%, a difference of 0.11%), and Portuguese (12.2%, a difference of 0.12%).
| Demographics | Rating | Rank | Divorced or Separated |
| Central Americans | 29.4 /100 | #199 | Fair 12.1% |
| South Americans | 28.6 /100 | #200 | Fair 12.2% |
| Guatemalans | 26.9 /100 | #201 | Fair 12.2% |
| Portuguese | 23.5 /100 | #202 | Fair 12.2% |
| Immigrants | Guatemala | 23.2 /100 | #203 | Fair 12.2% |
| Kenyans | 21.8 /100 | #204 | Fair 12.2% |
| Immigrants | Costa Rica | 21.3 /100 | #205 | Fair 12.2% |
| Slovaks | 21.0 /100 | #206 | Fair 12.2% |
| Mexicans | 21.0 /100 | #207 | Fair 12.2% |
| Immigrants | Ghana | 18.8 /100 | #208 | Poor 12.2% |
| Immigrants | Trinidad and Tobago | 17.8 /100 | #209 | Poor 12.2% |
| Slavs | 17.0 /100 | #210 | Poor 12.2% |
| Trinidadians and Tobagonians | 16.6 /100 | #211 | Poor 12.2% |
| Immigrants | Kenya | 16.5 /100 | #212 | Poor 12.2% |
| Immigrants | Eastern Africa | 16.2 /100 | #213 | Poor 12.2% |
Demographics Similar to Immigrants from Europe by Divorced or Separated
In terms of divorced or separated, the demographic groups most similar to Immigrants from Europe are Immigrants from Nepal (11.6%, a difference of 0.030%), Immigrants from Southern Europe (11.6%, a difference of 0.040%), Immigrants from Latvia (11.6%, a difference of 0.050%), Immigrants from Albania (11.5%, a difference of 0.12%), and Zimbabwean (11.6%, a difference of 0.14%).
| Demographics | Rating | Rank | Divorced or Separated |
| Russians | 99.4 /100 | #81 | Exceptional 11.5% |
| Immigrants | Romania | 99.3 /100 | #82 | Exceptional 11.5% |
| Immigrants | Bulgaria | 99.3 /100 | #83 | Exceptional 11.5% |
| Bulgarians | 99.3 /100 | #84 | Exceptional 11.5% |
| Immigrants | Albania | 99.3 /100 | #85 | Exceptional 11.5% |
| Immigrants | Latvia | 99.2 /100 | #86 | Exceptional 11.6% |
| Immigrants | Nepal | 99.2 /100 | #87 | Exceptional 11.6% |
| Immigrants | Europe | 99.2 /100 | #88 | Exceptional 11.6% |
| Immigrants | Southern Europe | 99.1 /100 | #89 | Exceptional 11.6% |
| Zimbabweans | 99.0 /100 | #90 | Exceptional 11.6% |
| Spanish American Indians | 99.0 /100 | #91 | Exceptional 11.6% |
| Immigrants | Denmark | 98.9 /100 | #92 | Exceptional 11.6% |
| Arabs | 98.9 /100 | #93 | Exceptional 11.6% |
| Immigrants | Fiji | 98.9 /100 | #94 | Exceptional 11.6% |
| Immigrants | Serbia | 98.8 /100 | #95 | Exceptional 11.6% |