Slovak vs Argentinean Divorced or Separated
COMPARE
Slovak
Argentinean
Divorced or Separated
Divorced or Separated Comparison
Slovaks
Argentineans
12.2%
DIVORCED OR SEPARATED
21.0/ 100
METRIC RATING
206th/ 347
METRIC RANK
11.9%
DIVORCED OR SEPARATED
85.1/ 100
METRIC RATING
134th/ 347
METRIC RANK
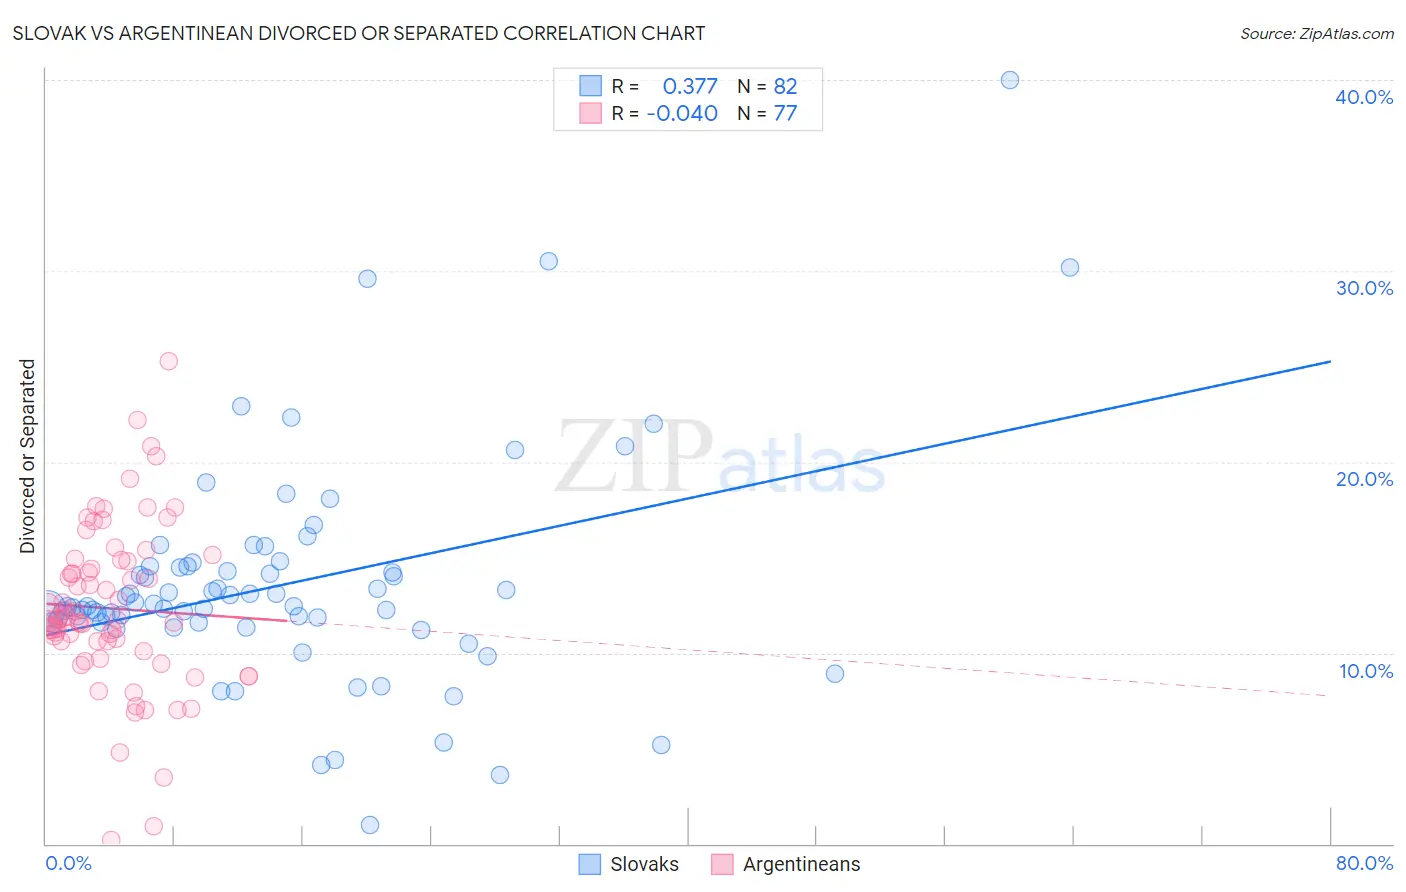
Slovak vs Argentinean Divorced or Separated Correlation Chart
The statistical analysis conducted on geographies consisting of 397,744,388 people shows a mild positive correlation between the proportion of Slovaks and percentage of population currently divorced or separated in the United States with a correlation coefficient (R) of 0.377 and weighted average of 12.2%. Similarly, the statistical analysis conducted on geographies consisting of 297,042,213 people shows no correlation between the proportion of Argentineans and percentage of population currently divorced or separated in the United States with a correlation coefficient (R) of -0.040 and weighted average of 11.9%, a difference of 2.7%.
Divorced or Separated Correlation Summary
| Measurement | Slovak | Argentinean |
| Minimum | 1.0% | 0.20% |
| Maximum | 40.0% | 25.3% |
| Range | 39.0% | 25.1% |
| Mean | 13.6% | 12.3% |
| Median | 12.4% | 11.8% |
| Interquartile 25% (IQ1) | 11.6% | 10.3% |
| Interquartile 75% (IQ3) | 14.6% | 14.8% |
| Interquartile Range (IQR) | 3.0% | 4.5% |
| Standard Deviation (Sample) | 5.9% | 4.3% |
| Standard Deviation (Population) | 5.9% | 4.3% |
Similar Demographics by Divorced or Separated
Demographics Similar to Slovaks by Divorced or Separated
In terms of divorced or separated, the demographic groups most similar to Slovaks are Mexican (12.2%, a difference of 0.0%), Immigrants from Costa Rica (12.2%, a difference of 0.010%), Kenyan (12.2%, a difference of 0.040%), Immigrants from Guatemala (12.2%, a difference of 0.11%), and Portuguese (12.2%, a difference of 0.12%).
| Demographics | Rating | Rank | Divorced or Separated |
| Central Americans | 29.4 /100 | #199 | Fair 12.1% |
| South Americans | 28.6 /100 | #200 | Fair 12.2% |
| Guatemalans | 26.9 /100 | #201 | Fair 12.2% |
| Portuguese | 23.5 /100 | #202 | Fair 12.2% |
| Immigrants | Guatemala | 23.2 /100 | #203 | Fair 12.2% |
| Kenyans | 21.8 /100 | #204 | Fair 12.2% |
| Immigrants | Costa Rica | 21.3 /100 | #205 | Fair 12.2% |
| Slovaks | 21.0 /100 | #206 | Fair 12.2% |
| Mexicans | 21.0 /100 | #207 | Fair 12.2% |
| Immigrants | Ghana | 18.8 /100 | #208 | Poor 12.2% |
| Immigrants | Trinidad and Tobago | 17.8 /100 | #209 | Poor 12.2% |
| Slavs | 17.0 /100 | #210 | Poor 12.2% |
| Trinidadians and Tobagonians | 16.6 /100 | #211 | Poor 12.2% |
| Immigrants | Kenya | 16.5 /100 | #212 | Poor 12.2% |
| Immigrants | Eastern Africa | 16.2 /100 | #213 | Poor 12.2% |
Demographics Similar to Argentineans by Divorced or Separated
In terms of divorced or separated, the demographic groups most similar to Argentineans are Danish (11.9%, a difference of 0.020%), Carpatho Rusyn (11.9%, a difference of 0.020%), Alsatian (11.9%, a difference of 0.080%), Immigrants from Netherlands (11.9%, a difference of 0.080%), and Australian (11.9%, a difference of 0.10%).
| Demographics | Rating | Rank | Divorced or Separated |
| South Africans | 88.9 /100 | #127 | Excellent 11.8% |
| Immigrants | Ecuador | 88.9 /100 | #128 | Excellent 11.8% |
| Immigrants | St. Vincent and the Grenadines | 88.4 /100 | #129 | Excellent 11.8% |
| Immigrants | Austria | 88.2 /100 | #130 | Excellent 11.8% |
| Immigrants | Cambodia | 88.2 /100 | #131 | Excellent 11.8% |
| Immigrants | Afghanistan | 87.9 /100 | #132 | Excellent 11.8% |
| New Zealanders | 87.5 /100 | #133 | Excellent 11.9% |
| Argentineans | 85.1 /100 | #134 | Excellent 11.9% |
| Danes | 84.8 /100 | #135 | Excellent 11.9% |
| Carpatho Rusyns | 84.8 /100 | #136 | Excellent 11.9% |
| Alsatians | 84.0 /100 | #137 | Excellent 11.9% |
| Immigrants | Netherlands | 83.9 /100 | #138 | Excellent 11.9% |
| Australians | 83.6 /100 | #139 | Excellent 11.9% |
| Lebanese | 83.4 /100 | #140 | Excellent 11.9% |
| Immigrants | Morocco | 82.9 /100 | #141 | Excellent 11.9% |