Asian vs Hungarian Divorced or Separated
COMPARE
Asian
Hungarian
Divorced or Separated
Divorced or Separated Comparison
Asians
Hungarians
10.6%
DIVORCED OR SEPARATED
100.0/ 100
METRIC RATING
19th/ 347
METRIC RANK
12.0%
DIVORCED OR SEPARATED
70.3/ 100
METRIC RATING
156th/ 347
METRIC RANK
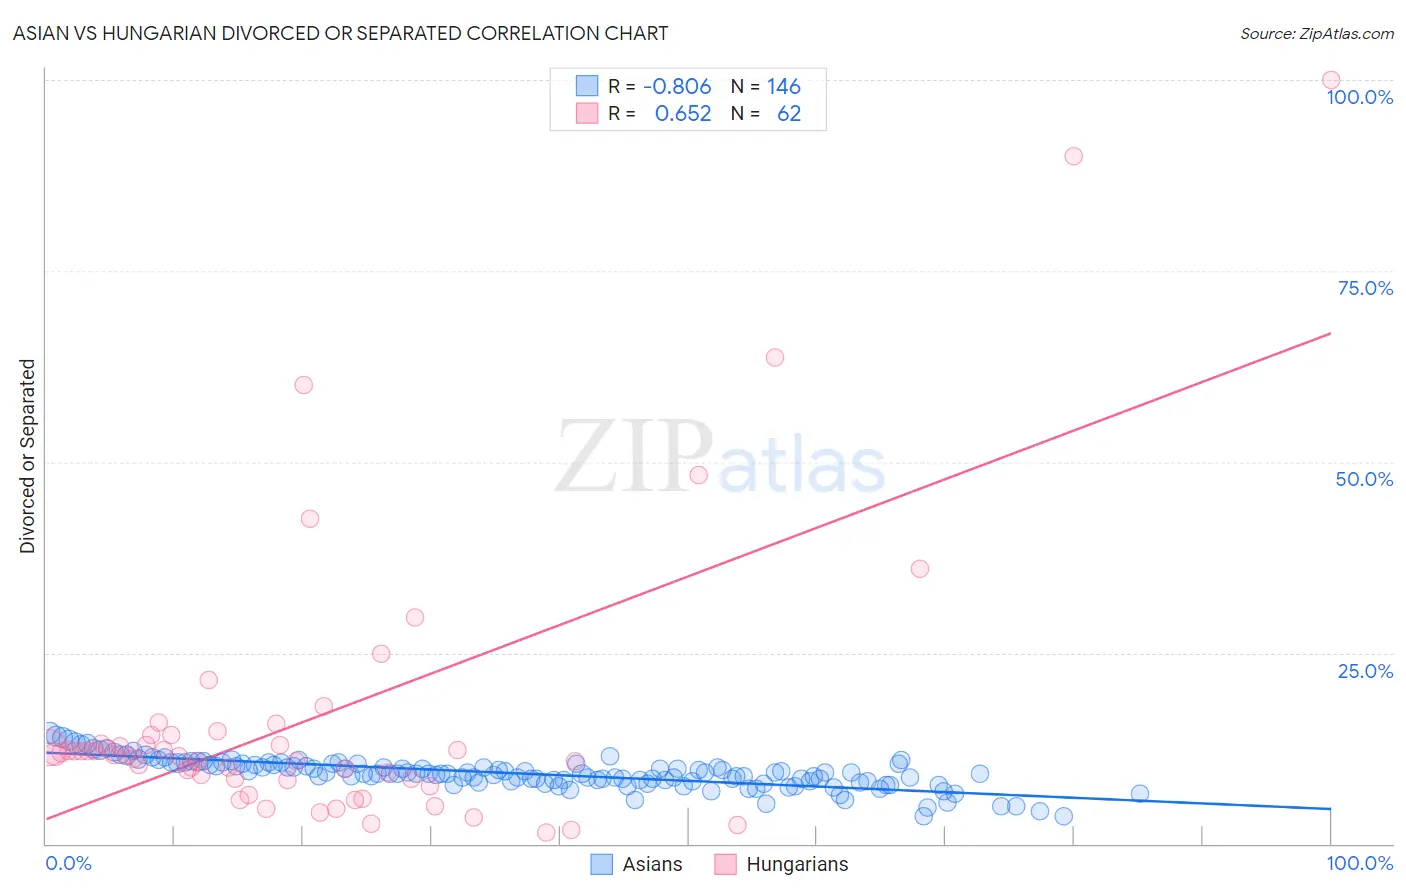
Asian vs Hungarian Divorced or Separated Correlation Chart
The statistical analysis conducted on geographies consisting of 550,451,547 people shows a very strong negative correlation between the proportion of Asians and percentage of population currently divorced or separated in the United States with a correlation coefficient (R) of -0.806 and weighted average of 10.6%. Similarly, the statistical analysis conducted on geographies consisting of 485,998,803 people shows a significant positive correlation between the proportion of Hungarians and percentage of population currently divorced or separated in the United States with a correlation coefficient (R) of 0.652 and weighted average of 12.0%, a difference of 12.5%.
Divorced or Separated Correlation Summary
| Measurement | Asian | Hungarian |
| Minimum | 3.6% | 1.4% |
| Maximum | 14.5% | 100.0% |
| Range | 10.9% | 98.6% |
| Mean | 9.2% | 16.6% |
| Median | 9.2% | 11.7% |
| Interquartile 25% (IQ1) | 8.2% | 8.5% |
| Interquartile 75% (IQ3) | 10.5% | 14.2% |
| Interquartile Range (IQR) | 2.3% | 5.8% |
| Standard Deviation (Sample) | 2.0% | 19.0% |
| Standard Deviation (Population) | 2.0% | 18.8% |
Similar Demographics by Divorced or Separated
Demographics Similar to Asians by Divorced or Separated
In terms of divorced or separated, the demographic groups most similar to Asians are Immigrants from Iran (10.6%, a difference of 0.0%), Immigrants from Israel (10.6%, a difference of 0.090%), Immigrants from Korea (10.6%, a difference of 0.20%), Immigrants from Armenia (10.6%, a difference of 0.64%), and Assyrian/Chaldean/Syriac (10.6%, a difference of 0.71%).
| Demographics | Rating | Rank | Divorced or Separated |
| Okinawans | 100.0 /100 | #12 | Exceptional 10.5% |
| Cypriots | 100.0 /100 | #13 | Exceptional 10.5% |
| Assyrians/Chaldeans/Syriacs | 100.0 /100 | #14 | Exceptional 10.6% |
| Immigrants | Armenia | 100.0 /100 | #15 | Exceptional 10.6% |
| Immigrants | Korea | 100.0 /100 | #16 | Exceptional 10.6% |
| Immigrants | Israel | 100.0 /100 | #17 | Exceptional 10.6% |
| Immigrants | Iran | 100.0 /100 | #18 | Exceptional 10.6% |
| Asians | 100.0 /100 | #19 | Exceptional 10.6% |
| Burmese | 100.0 /100 | #20 | Exceptional 10.7% |
| Immigrants | Asia | 100.0 /100 | #21 | Exceptional 10.7% |
| Vietnamese | 100.0 /100 | #22 | Exceptional 10.8% |
| Immigrants | Pakistan | 100.0 /100 | #23 | Exceptional 10.8% |
| Immigrants | Sri Lanka | 100.0 /100 | #24 | Exceptional 10.8% |
| Iranians | 100.0 /100 | #25 | Exceptional 10.8% |
| Immigrants | Indonesia | 100.0 /100 | #26 | Exceptional 10.9% |
Demographics Similar to Hungarians by Divorced or Separated
In terms of divorced or separated, the demographic groups most similar to Hungarians are Japanese (12.0%, a difference of 0.020%), Chilean (12.0%, a difference of 0.040%), Immigrants from Brazil (12.0%, a difference of 0.060%), Austrian (12.0%, a difference of 0.080%), and Immigrants from Hungary (11.9%, a difference of 0.15%).
| Demographics | Rating | Rank | Divorced or Separated |
| Immigrants | Oceania | 77.7 /100 | #149 | Good 11.9% |
| Immigrants | Portugal | 77.3 /100 | #150 | Good 11.9% |
| Czechs | 76.4 /100 | #151 | Good 11.9% |
| Immigrants | Hungary | 73.7 /100 | #152 | Good 11.9% |
| Austrians | 72.2 /100 | #153 | Good 12.0% |
| Chileans | 71.3 /100 | #154 | Good 12.0% |
| Japanese | 70.9 /100 | #155 | Good 12.0% |
| Hungarians | 70.3 /100 | #156 | Good 12.0% |
| Immigrants | Brazil | 68.8 /100 | #157 | Good 12.0% |
| Icelanders | 66.0 /100 | #158 | Good 12.0% |
| Immigrants | Barbados | 66.0 /100 | #159 | Good 12.0% |
| Immigrants | Scotland | 65.8 /100 | #160 | Good 12.0% |
| Marshallese | 64.6 /100 | #161 | Good 12.0% |
| Samoans | 64.3 /100 | #162 | Good 12.0% |
| Navajo | 63.9 /100 | #163 | Good 12.0% |