Slovak vs Hungarian 10th Grade

COMPARE

Slovak
Race
Ancestry
AfghanAfricanAlaska NativeAlaskan AthabascanAlbanianAleutAlsatianAmericanApacheArabArapahoArgentineanArmenianAssyrian/Chaldean/SyriacAustralianAustrianBahamianBangladeshiBarbadianBasqueBelgianBelizeanBermudanBhutaneseBlackfeetBolivianBrazilianBritishBritish West IndianBulgarianBurmeseCajunCambodianCanadianCape VerdeanCarpatho RusynCelticCentral AmericanCentral American IndianCherokeeCheyenneChickasawChileanChineseChippewaChoctawColombianColvilleComancheCosta RicanCreeCreekCroatianCrowCubanCypriotCzechCzechoslovakianDanishDelawareDominicanDutchDutch West IndianEastern EuropeanEcuadorianEgyptianEnglishEstonianEthiopianEuropeanFijianFilipinoFinnishFrenchFrench American IndianFrench CanadianGermanGerman RussianGhanaianGreekGuamanian/ChamorroGuatemalanGuyaneseHaitianHmongHonduranHopiHoumaIcelanderIndian (Asian)IndonesianInupiatIranianIraqiIrishIroquoisIsraeliItalianJamaicanJapaneseJordanianKenyanKiowaKoreanLaotianLatvianLebaneseLiberianLithuanianLumbeeLuxembourgerMacedonianMalaysianMalteseMarshalleseMenomineeMexicanMexican American IndianMongolianMoroccanNative HawaiianNavajoNepaleseNew ZealanderNicaraguanNigerianNorthern EuropeanNorwegianOkinawanOsageOttawaPaiutePakistaniPalestinianPanamanianParaguayanPennsylvania GermanPeruvianPimaPolishPortuguesePotawatomiPuebloPuerto RicanPuget Sound SalishRomanianRussianSalvadoranSamoanScandinavianScotch-IrishScottishSeminoleSenegaleseSerbianShoshoneSierra LeoneanSiouxSlavicSlovakSloveneSomaliSouth AfricanSouth AmericanSouth American IndianSoviet UnionSpaniardSpanishSpanish AmericanSpanish American IndianSri LankanSubsaharan AfricanSudaneseSwedishSwissSyrianTaiwaneseThaiTlingit-HaidaTohono O'OdhamTonganTrinidadian and TobagonianTsimshianTurkishU.S. Virgin IslanderUgandanUkrainianUruguayanUteVenezuelanVietnameseWelshWest IndianYakamaYaquiYugoslavianYumanYup'ikZimbabwean
Immigration
NonimmigrantsImmigrantsAfghanistanAfricaAlbaniaArgentinaArmeniaAsiaAustraliaAustriaBahamasBangladeshBarbadosBelarusBelgiumBelizeBoliviaBosnia and HerzegovinaBrazilBulgariaBurma/MyanmarCabo VerdeCambodiaCameroonCanadaCaribbeanCentral AmericaChileChinaColombiaCongoCosta RicaCroatiaCubaCzechoslovakiaDenmarkDominicaDominican RepublicEastern AfricaEastern AsiaEastern EuropeEcuadorEgyptEl SalvadorEnglandEritreaEthiopiaEuropeFijiFranceGermanyGhanaGreeceGrenadaGuatemalaGuyanaHaitiHondurasHong KongHungaryIndiaIndonesiaIranIraqIrelandIsraelItalyJamaicaJapanJordanKazakhstanKenyaKoreaKuwaitLaosLatin AmericaLatviaLebanonLiberiaLithuaniaMalaysiaMexicoMicronesiaMiddle AfricaMoldovaMoroccoNepalNetherlandsNicaraguaNigeriaNorth AmericaNorth MacedoniaNorthern AfricaNorthern EuropeNorwayOceaniaPakistanPanamaPeruPhilippinesPolandPortugalRomaniaRussiaSaudi ArabiaScotlandSenegalSerbiaSierra LeoneSingaporeSomaliaSouth AfricaSouth AmericaSouth Central AsiaSouth Eastern AsiaSouthern EuropeSpainSri LankaSt. Vincent and the GrenadinesSudanSwedenSwitzerlandSyriaTaiwanThailandTrinidad and TobagoTurkeyUgandaUkraineUruguayUzbekistanVenezuelaVietnamWest IndiesWestern AfricaWestern AsiaWestern EuropeYemenZaireZimbabweAzores
Hungarian
Race
Ancestry
AfghanAfricanAlaska NativeAlaskan AthabascanAlbanianAleutAlsatianAmericanApacheArabArapahoArgentineanArmenianAssyrian/Chaldean/SyriacAustralianAustrianBahamianBangladeshiBarbadianBasqueBelgianBelizeanBermudanBhutaneseBlackfeetBolivianBrazilianBritishBritish West IndianBulgarianBurmeseCajunCambodianCanadianCape VerdeanCarpatho RusynCelticCentral AmericanCentral American IndianCherokeeCheyenneChickasawChileanChineseChippewaChoctawColombianColvilleComancheCosta RicanCreeCreekCroatianCrowCubanCypriotCzechCzechoslovakianDanishDelawareDominicanDutchDutch West IndianEastern EuropeanEcuadorianEgyptianEnglishEstonianEthiopianEuropeanFijianFilipinoFinnishFrenchFrench American IndianFrench CanadianGermanGerman RussianGhanaianGreekGuamanian/ChamorroGuatemalanGuyaneseHaitianHmongHonduranHopiHoumaHungarianIcelanderIndian (Asian)IndonesianInupiatIranianIraqiIrishIroquoisIsraeliItalianJamaicanJapaneseJordanianKenyanKiowaKoreanLaotianLatvianLebaneseLiberianLithuanianLumbeeLuxembourgerMacedonianMalaysianMalteseMarshalleseMenomineeMexicanMexican American IndianMongolianMoroccanNative HawaiianNavajoNepaleseNew ZealanderNicaraguanNigerianNorthern EuropeanNorwegianOkinawanOsageOttawaPaiutePakistaniPalestinianPanamanianParaguayanPennsylvania GermanPeruvianPimaPolishPortuguesePotawatomiPuebloPuerto RicanPuget Sound SalishRomanianRussianSalvadoranSamoanScandinavianScotch-IrishScottishSeminoleSenegaleseSerbianShoshoneSierra LeoneanSiouxSlavicSloveneSomaliSouth AfricanSouth AmericanSouth American IndianSoviet UnionSpaniardSpanishSpanish AmericanSpanish American IndianSri LankanSubsaharan AfricanSudaneseSwedishSwissSyrianTaiwaneseThaiTlingit-HaidaTohono O'OdhamTonganTrinidadian and TobagonianTsimshianTurkishU.S. Virgin IslanderUgandanUkrainianUruguayanUteVenezuelanVietnameseWelshWest IndianYakamaYaquiYugoslavianYumanYup'ikZimbabwean
Immigration
NonimmigrantsImmigrantsAfghanistanAfricaAlbaniaArgentinaArmeniaAsiaAustraliaAustriaBahamasBangladeshBarbadosBelarusBelgiumBelizeBoliviaBosnia and HerzegovinaBrazilBulgariaBurma/MyanmarCabo VerdeCambodiaCameroonCanadaCaribbeanCentral AmericaChileChinaColombiaCongoCosta RicaCroatiaCubaCzechoslovakiaDenmarkDominicaDominican RepublicEastern AfricaEastern AsiaEastern EuropeEcuadorEgyptEl SalvadorEnglandEritreaEthiopiaEuropeFijiFranceGermanyGhanaGreeceGrenadaGuatemalaGuyanaHaitiHondurasHong KongHungaryIndiaIndonesiaIranIraqIrelandIsraelItalyJamaicaJapanJordanKazakhstanKenyaKoreaKuwaitLaosLatin AmericaLatviaLebanonLiberiaLithuaniaMalaysiaMexicoMicronesiaMiddle AfricaMoldovaMoroccoNepalNetherlandsNicaraguaNigeriaNorth AmericaNorth MacedoniaNorthern AfricaNorthern EuropeNorwayOceaniaPakistanPanamaPeruPhilippinesPolandPortugalRomaniaRussiaSaudi ArabiaScotlandSenegalSerbiaSierra LeoneSingaporeSomaliaSouth AfricaSouth AmericaSouth Central AsiaSouth Eastern AsiaSouthern EuropeSpainSri LankaSt. Vincent and the GrenadinesSudanSwedenSwitzerlandSyriaTaiwanThailandTrinidad and TobagoTurkeyUgandaUkraineUruguayUzbekistanVenezuelaVietnamWest IndiesWestern AfricaWestern AsiaWestern EuropeYemenZaireZimbabweAzores
10th Grade
Income
Poverty
Unemployment
Labor Participation
Family Structure
Vehicle Availability
Education Level
Disability

10th Grade Comparison

Slovaks

Hungarians

Exceptional
Exceptional
96.0%
10TH GRADE
100.0/ 100
METRIC RATING
2nd/ 347
METRIC RANK
95.3%
10TH GRADE
100.0/ 100
METRIC RATING
32nd/ 347
METRIC RANK

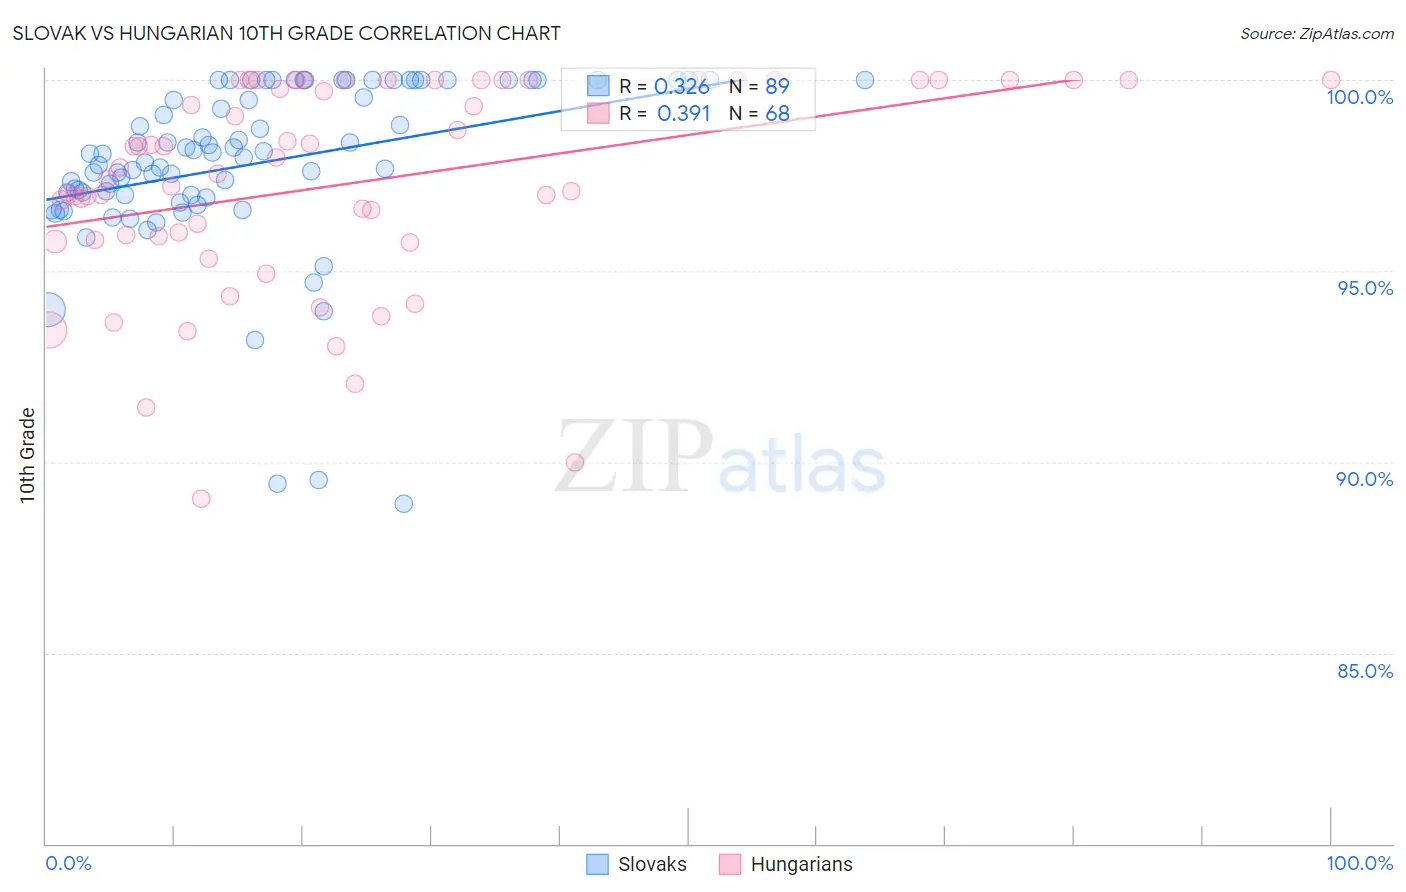
Slovak vs Hungarian 10th Grade Correlation Chart

The statistical analysis conducted on geographies consisting of 397,891,887 people shows a mild positive correlation between the proportion of Slovaks and percentage of population with at least 10th grade education in the United States with a correlation coefficient (R) of 0.326 and weighted average of 96.0%. Similarly, the statistical analysis conducted on geographies consisting of 486,239,864 people shows a mild positive correlation between the proportion of Hungarians and percentage of population with at least 10th grade education in the United States with a correlation coefficient (R) of 0.391 and weighted average of 95.3%, a difference of 0.75%.
Slovak vs Hungarian 10th Grade

10th Grade Correlation Summary

MeasurementSlovakHungarian
Minimum88.9%89.0%
Maximum100.0%100.0%
Range11.1%11.0%
Mean97.8%97.3%
Median98.1%97.6%
Interquartile 25% (IQ1)97.0%95.9%
Interquartile 75% (IQ3)100.0%100.0%
Interquartile Range (IQR)3.0%4.1%
Standard Deviation (Sample)2.3%2.7%
Standard Deviation (Population)2.2%2.7%

Similar Demographics by 10th Grade

Demographics Similar to Slovaks by 10th Grade

In terms of 10th grade, the demographic groups most similar to Slovaks are Slovene (95.9%, a difference of 0.10%), Swedish (95.9%, a difference of 0.10%), Carpatho Rusyn (95.9%, a difference of 0.12%), Norwegian (96.2%, a difference of 0.13%), and Polish (95.8%, a difference of 0.23%).
DemographicsRating | Rank10th Grade
Norwegians
100.0
/100
|
#1
Exceptional
96.2%
Slovaks
100.0
/100
|
#2
Exceptional
96.0%
Slovenes
100.0
/100
|
#3
Exceptional
95.9%
Swedes
100.0
/100
|
#4
Exceptional
95.9%
Carpatho Rusyns
100.0
/100
|
#5
Exceptional
95.9%
Poles
100.0
/100
|
#6
Exceptional
95.8%
Germans
100.0
/100
|
#7
Exceptional
95.8%
Lithuanians
100.0
/100
|
#8
Exceptional
95.8%
Finns
100.0
/100
|
#9
Exceptional
95.8%
Croatians
100.0
/100
|
#10
Exceptional
95.7%
Danes
100.0
/100
|
#11
Exceptional
95.7%
Tlingit-Haida
100.0
/100
|
#12
Exceptional
95.7%
English
100.0
/100
|
#13
Exceptional
95.6%
Tsimshian
100.0
/100
|
#14
Exceptional
95.6%
Irish
100.0
/100
|
#15
Exceptional
95.6%

Demographics Similar to Hungarians by 10th Grade

In terms of 10th grade, the demographic groups most similar to Hungarians are Iranian (95.3%, a difference of 0.0%), French (95.3%, a difference of 0.0%), British (95.3%, a difference of 0.010%), Belgian (95.4%, a difference of 0.020%), and Estonian (95.3%, a difference of 0.020%).
DemographicsRating | Rank10th Grade
Maltese
100.0
/100
|
#25
Exceptional
95.5%
Welsh
100.0
/100
|
#26
Exceptional
95.5%
Alaskan Athabascans
100.0
/100
|
#27
Exceptional
95.4%
Luxembourgers
100.0
/100
|
#28
Exceptional
95.4%
Bulgarians
100.0
/100
|
#29
Exceptional
95.4%
Belgians
100.0
/100
|
#30
Exceptional
95.4%
Iranians
100.0
/100
|
#31
Exceptional
95.3%
Hungarians
100.0
/100
|
#32
Exceptional
95.3%
French
100.0
/100
|
#33
Exceptional
95.3%
British
99.9
/100
|
#34
Exceptional
95.3%
Estonians
99.9
/100
|
#35
Exceptional
95.3%
Immigrants | India
99.9
/100
|
#36
Exceptional
95.3%
French Canadians
99.9
/100
|
#37
Exceptional
95.3%
Northern Europeans
99.9
/100
|
#38
Exceptional
95.3%
Immigrants | Scotland
99.9
/100
|
#39
Exceptional
95.2%