Slovak vs Barbadian Divorced or Separated
COMPARE
Slovak
Barbadian
Divorced or Separated
Divorced or Separated Comparison
Slovaks
Barbadians
12.2%
DIVORCED OR SEPARATED
21.0/ 100
METRIC RATING
206th/ 347
METRIC RANK
12.1%
DIVORCED OR SEPARATED
45.0/ 100
METRIC RATING
180th/ 347
METRIC RANK
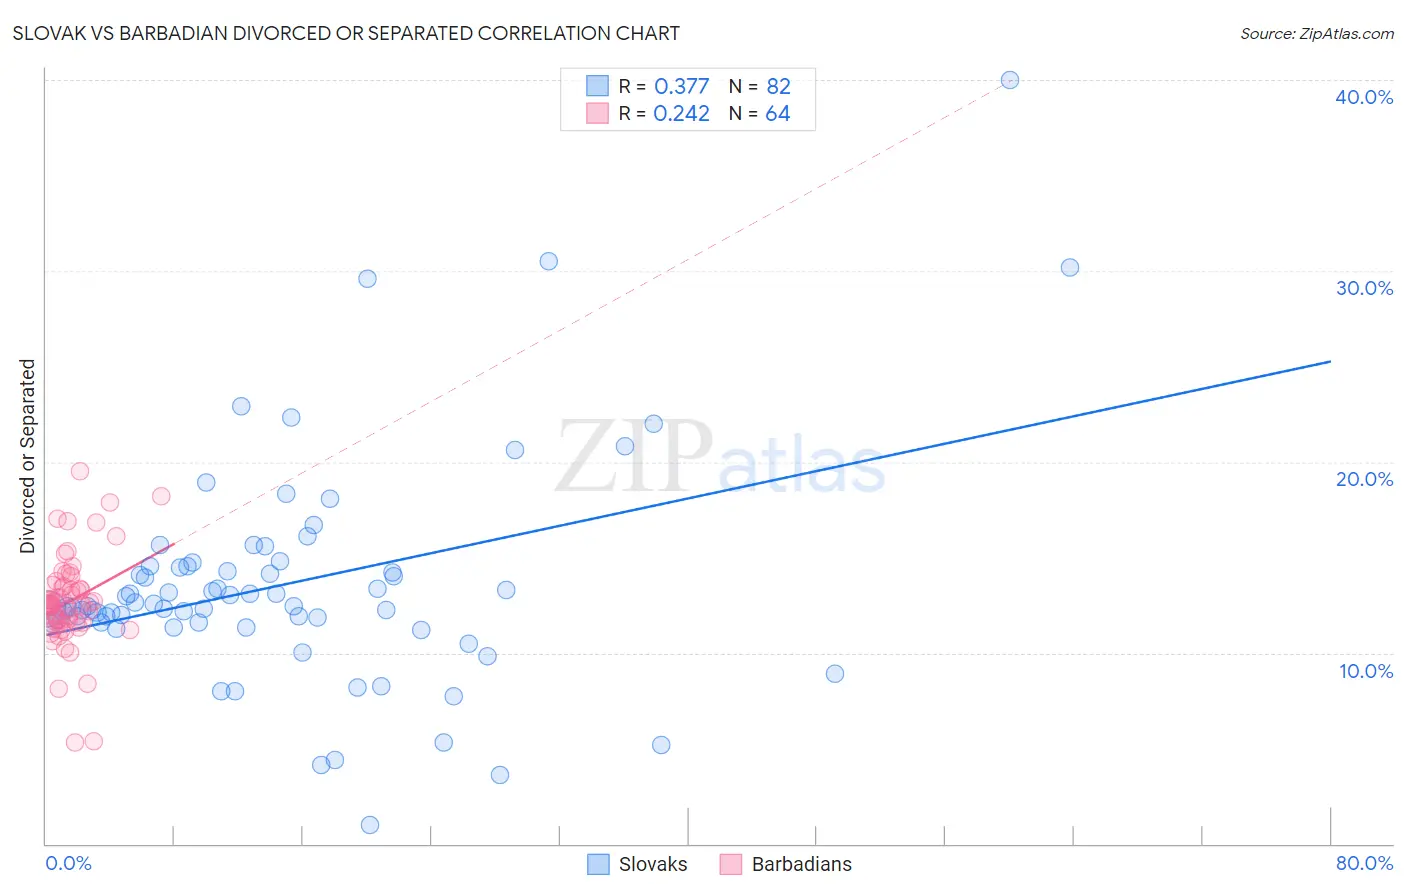
Slovak vs Barbadian Divorced or Separated Correlation Chart
The statistical analysis conducted on geographies consisting of 397,744,388 people shows a mild positive correlation between the proportion of Slovaks and percentage of population currently divorced or separated in the United States with a correlation coefficient (R) of 0.377 and weighted average of 12.2%. Similarly, the statistical analysis conducted on geographies consisting of 141,266,307 people shows a weak positive correlation between the proportion of Barbadians and percentage of population currently divorced or separated in the United States with a correlation coefficient (R) of 0.242 and weighted average of 12.1%, a difference of 0.97%.
Divorced or Separated Correlation Summary
| Measurement | Slovak | Barbadian |
| Minimum | 1.0% | 5.3% |
| Maximum | 40.0% | 19.5% |
| Range | 39.0% | 14.2% |
| Mean | 13.6% | 12.7% |
| Median | 12.4% | 12.6% |
| Interquartile 25% (IQ1) | 11.6% | 11.6% |
| Interquartile 75% (IQ3) | 14.6% | 13.5% |
| Interquartile Range (IQR) | 3.0% | 1.9% |
| Standard Deviation (Sample) | 5.9% | 2.5% |
| Standard Deviation (Population) | 5.9% | 2.5% |
Similar Demographics by Divorced or Separated
Demographics Similar to Slovaks by Divorced or Separated
In terms of divorced or separated, the demographic groups most similar to Slovaks are Mexican (12.2%, a difference of 0.0%), Immigrants from Costa Rica (12.2%, a difference of 0.010%), Kenyan (12.2%, a difference of 0.040%), Immigrants from Guatemala (12.2%, a difference of 0.11%), and Portuguese (12.2%, a difference of 0.12%).
| Demographics | Rating | Rank | Divorced or Separated |
| Central Americans | 29.4 /100 | #199 | Fair 12.1% |
| South Americans | 28.6 /100 | #200 | Fair 12.2% |
| Guatemalans | 26.9 /100 | #201 | Fair 12.2% |
| Portuguese | 23.5 /100 | #202 | Fair 12.2% |
| Immigrants | Guatemala | 23.2 /100 | #203 | Fair 12.2% |
| Kenyans | 21.8 /100 | #204 | Fair 12.2% |
| Immigrants | Costa Rica | 21.3 /100 | #205 | Fair 12.2% |
| Slovaks | 21.0 /100 | #206 | Fair 12.2% |
| Mexicans | 21.0 /100 | #207 | Fair 12.2% |
| Immigrants | Ghana | 18.8 /100 | #208 | Poor 12.2% |
| Immigrants | Trinidad and Tobago | 17.8 /100 | #209 | Poor 12.2% |
| Slavs | 17.0 /100 | #210 | Poor 12.2% |
| Trinidadians and Tobagonians | 16.6 /100 | #211 | Poor 12.2% |
| Immigrants | Kenya | 16.5 /100 | #212 | Poor 12.2% |
| Immigrants | Eastern Africa | 16.2 /100 | #213 | Poor 12.2% |
Demographics Similar to Barbadians by Divorced or Separated
In terms of divorced or separated, the demographic groups most similar to Barbadians are Immigrants from Western Europe (12.1%, a difference of 0.020%), Ghanaian (12.1%, a difference of 0.030%), Immigrants from Canada (12.1%, a difference of 0.030%), Immigrants from Ethiopia (12.1%, a difference of 0.070%), and Immigrants from Central America (12.1%, a difference of 0.070%).
| Demographics | Rating | Rank | Divorced or Separated |
| Immigrants | Moldova | 50.4 /100 | #173 | Average 12.1% |
| Hawaiians | 50.0 /100 | #174 | Average 12.1% |
| Immigrants | Sierra Leone | 50.0 /100 | #175 | Average 12.1% |
| Pennsylvania Germans | 48.9 /100 | #176 | Average 12.1% |
| Brazilians | 47.7 /100 | #177 | Average 12.1% |
| Ghanaians | 45.9 /100 | #178 | Average 12.1% |
| Immigrants | Western Europe | 45.6 /100 | #179 | Average 12.1% |
| Barbadians | 45.0 /100 | #180 | Average 12.1% |
| Immigrants | Canada | 44.0 /100 | #181 | Average 12.1% |
| Immigrants | Ethiopia | 43.1 /100 | #182 | Average 12.1% |
| Immigrants | Central America | 42.9 /100 | #183 | Average 12.1% |
| Immigrants | North America | 41.1 /100 | #184 | Average 12.1% |
| Immigrants | Nigeria | 40.5 /100 | #185 | Average 12.1% |
| Immigrants | Chile | 39.0 /100 | #186 | Fair 12.1% |
| Belizeans | 37.7 /100 | #187 | Fair 12.1% |