Slovak vs Aleut Divorced or Separated
COMPARE
Slovak
Aleut
Divorced or Separated
Divorced or Separated Comparison
Slovaks
Aleuts
12.2%
DIVORCED OR SEPARATED
21.0/ 100
METRIC RATING
206th/ 347
METRIC RANK
12.5%
DIVORCED OR SEPARATED
1.3/ 100
METRIC RATING
251st/ 347
METRIC RANK
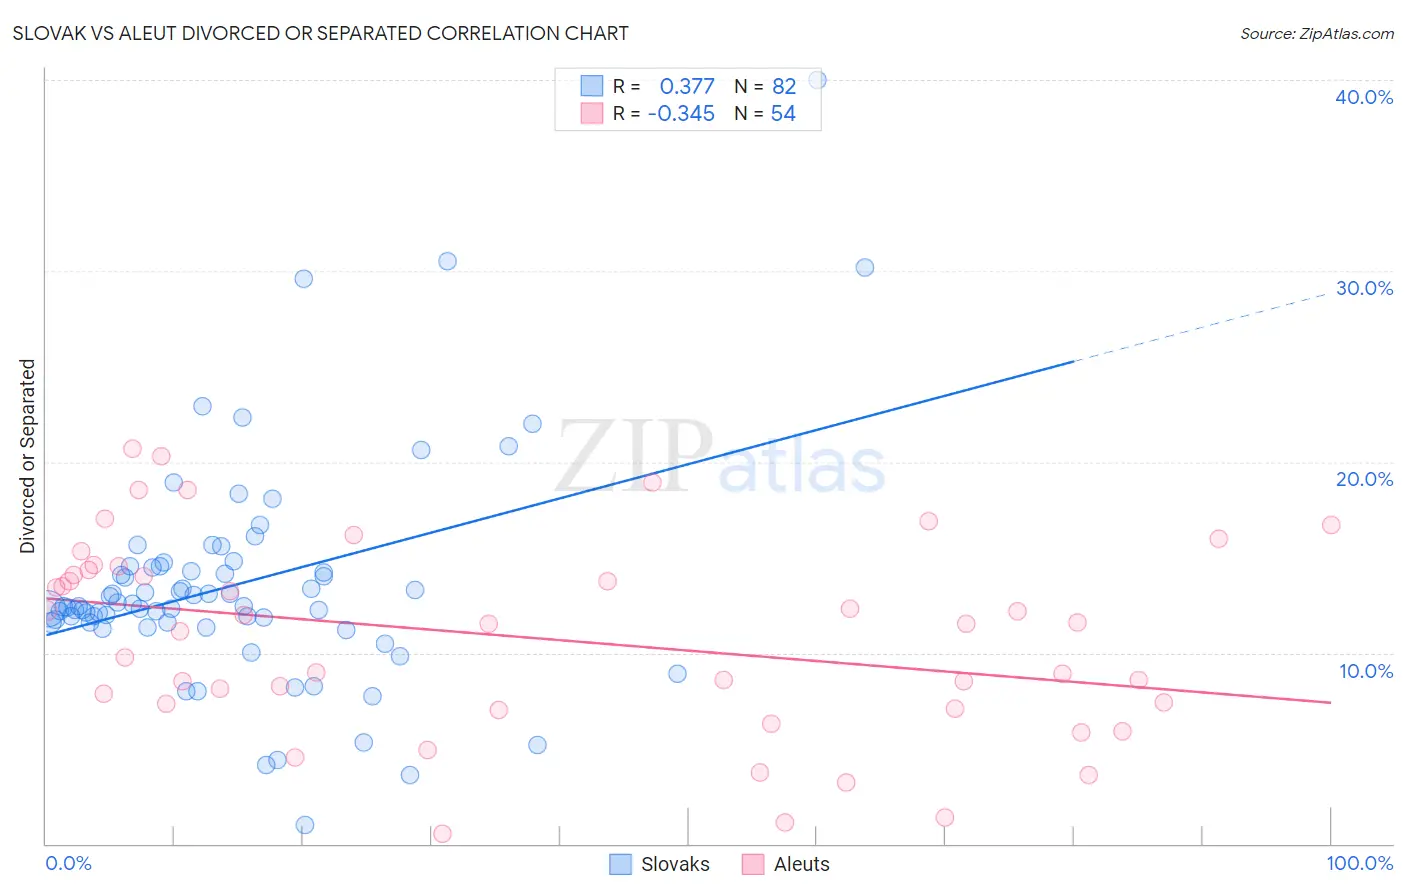
Slovak vs Aleut Divorced or Separated Correlation Chart
The statistical analysis conducted on geographies consisting of 397,744,388 people shows a mild positive correlation between the proportion of Slovaks and percentage of population currently divorced or separated in the United States with a correlation coefficient (R) of 0.377 and weighted average of 12.2%. Similarly, the statistical analysis conducted on geographies consisting of 61,777,142 people shows a mild negative correlation between the proportion of Aleuts and percentage of population currently divorced or separated in the United States with a correlation coefficient (R) of -0.345 and weighted average of 12.5%, a difference of 2.6%.
Divorced or Separated Correlation Summary
| Measurement | Slovak | Aleut |
| Minimum | 1.0% | 0.50% |
| Maximum | 40.0% | 20.7% |
| Range | 39.0% | 20.2% |
| Mean | 13.6% | 10.8% |
| Median | 12.4% | 11.5% |
| Interquartile 25% (IQ1) | 11.6% | 7.3% |
| Interquartile 75% (IQ3) | 14.6% | 14.3% |
| Interquartile Range (IQR) | 3.0% | 7.0% |
| Standard Deviation (Sample) | 5.9% | 5.1% |
| Standard Deviation (Population) | 5.9% | 5.0% |
Similar Demographics by Divorced or Separated
Demographics Similar to Slovaks by Divorced or Separated
In terms of divorced or separated, the demographic groups most similar to Slovaks are Mexican (12.2%, a difference of 0.0%), Immigrants from Costa Rica (12.2%, a difference of 0.010%), Kenyan (12.2%, a difference of 0.040%), Immigrants from Guatemala (12.2%, a difference of 0.11%), and Portuguese (12.2%, a difference of 0.12%).
| Demographics | Rating | Rank | Divorced or Separated |
| Central Americans | 29.4 /100 | #199 | Fair 12.1% |
| South Americans | 28.6 /100 | #200 | Fair 12.2% |
| Guatemalans | 26.9 /100 | #201 | Fair 12.2% |
| Portuguese | 23.5 /100 | #202 | Fair 12.2% |
| Immigrants | Guatemala | 23.2 /100 | #203 | Fair 12.2% |
| Kenyans | 21.8 /100 | #204 | Fair 12.2% |
| Immigrants | Costa Rica | 21.3 /100 | #205 | Fair 12.2% |
| Slovaks | 21.0 /100 | #206 | Fair 12.2% |
| Mexicans | 21.0 /100 | #207 | Fair 12.2% |
| Immigrants | Ghana | 18.8 /100 | #208 | Poor 12.2% |
| Immigrants | Trinidad and Tobago | 17.8 /100 | #209 | Poor 12.2% |
| Slavs | 17.0 /100 | #210 | Poor 12.2% |
| Trinidadians and Tobagonians | 16.6 /100 | #211 | Poor 12.2% |
| Immigrants | Kenya | 16.5 /100 | #212 | Poor 12.2% |
| Immigrants | Eastern Africa | 16.2 /100 | #213 | Poor 12.2% |
Demographics Similar to Aleuts by Divorced or Separated
In terms of divorced or separated, the demographic groups most similar to Aleuts are Irish (12.5%, a difference of 0.0%), Finnish (12.5%, a difference of 0.28%), Nepalese (12.5%, a difference of 0.29%), German (12.5%, a difference of 0.31%), and Liberian (12.6%, a difference of 0.33%).
| Demographics | Rating | Rank | Divorced or Separated |
| Alaska Natives | 2.5 /100 | #244 | Tragic 12.4% |
| Hispanics or Latinos | 2.0 /100 | #245 | Tragic 12.5% |
| Immigrants | West Indies | 1.9 /100 | #246 | Tragic 12.5% |
| Germans | 1.8 /100 | #247 | Tragic 12.5% |
| Nepalese | 1.8 /100 | #248 | Tragic 12.5% |
| Finns | 1.8 /100 | #249 | Tragic 12.5% |
| Irish | 1.3 /100 | #250 | Tragic 12.5% |
| Aleuts | 1.3 /100 | #251 | Tragic 12.5% |
| Liberians | 0.9 /100 | #252 | Tragic 12.6% |
| Somalis | 0.9 /100 | #253 | Tragic 12.6% |
| Senegalese | 0.8 /100 | #254 | Tragic 12.6% |
| Welsh | 0.7 /100 | #255 | Tragic 12.6% |
| Immigrants | Colombia | 0.6 /100 | #256 | Tragic 12.6% |
| Immigrants | Somalia | 0.6 /100 | #257 | Tragic 12.6% |
| Indonesians | 0.6 /100 | #258 | Tragic 12.6% |