Immigrants from Middle Africa vs Argentinean Divorced or Separated
COMPARE
Immigrants from Middle Africa
Argentinean
Divorced or Separated
Divorced or Separated Comparison
Immigrants from Middle Africa
Argentineans
12.7%
DIVORCED OR SEPARATED
0.3/ 100
METRIC RATING
272nd/ 347
METRIC RANK
11.9%
DIVORCED OR SEPARATED
85.1/ 100
METRIC RATING
134th/ 347
METRIC RANK
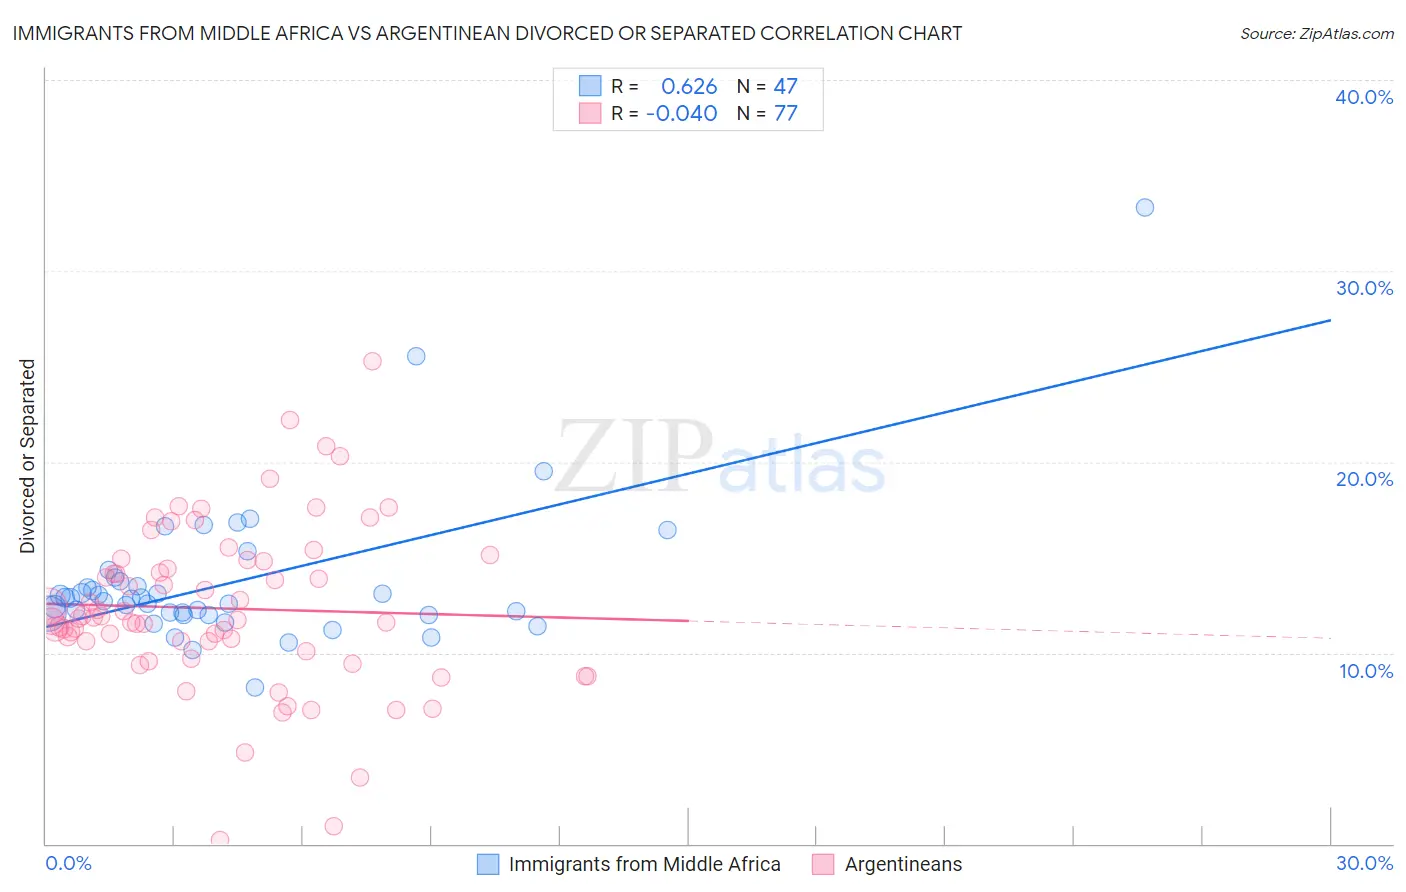
Immigrants from Middle Africa vs Argentinean Divorced or Separated Correlation Chart
The statistical analysis conducted on geographies consisting of 202,678,495 people shows a significant positive correlation between the proportion of Immigrants from Middle Africa and percentage of population currently divorced or separated in the United States with a correlation coefficient (R) of 0.626 and weighted average of 12.7%. Similarly, the statistical analysis conducted on geographies consisting of 297,042,213 people shows no correlation between the proportion of Argentineans and percentage of population currently divorced or separated in the United States with a correlation coefficient (R) of -0.040 and weighted average of 11.9%, a difference of 6.6%.
Divorced or Separated Correlation Summary
| Measurement | Immigrants from Middle Africa | Argentinean |
| Minimum | 8.2% | 0.20% |
| Maximum | 33.3% | 25.3% |
| Range | 25.1% | 25.1% |
| Mean | 13.7% | 12.3% |
| Median | 12.8% | 11.8% |
| Interquartile 25% (IQ1) | 12.0% | 10.3% |
| Interquartile 75% (IQ3) | 13.7% | 14.8% |
| Interquartile Range (IQR) | 1.7% | 4.5% |
| Standard Deviation (Sample) | 4.0% | 4.3% |
| Standard Deviation (Population) | 3.9% | 4.3% |
Similar Demographics by Divorced or Separated
Demographics Similar to Immigrants from Middle Africa by Divorced or Separated
In terms of divorced or separated, the demographic groups most similar to Immigrants from Middle Africa are Panamanian (12.7%, a difference of 0.050%), Ute (12.6%, a difference of 0.11%), Immigrants from Micronesia (12.7%, a difference of 0.12%), Bermudan (12.7%, a difference of 0.13%), and Central American Indian (12.7%, a difference of 0.16%).
| Demographics | Rating | Rank | Divorced or Separated |
| Immigrants | Senegal | 0.5 /100 | #265 | Tragic 12.6% |
| Whites/Caucasians | 0.5 /100 | #266 | Tragic 12.6% |
| Scottish | 0.4 /100 | #267 | Tragic 12.6% |
| Fijians | 0.4 /100 | #268 | Tragic 12.6% |
| Immigrants | Liberia | 0.4 /100 | #269 | Tragic 12.6% |
| Ute | 0.4 /100 | #270 | Tragic 12.6% |
| Panamanians | 0.3 /100 | #271 | Tragic 12.7% |
| Immigrants | Middle Africa | 0.3 /100 | #272 | Tragic 12.7% |
| Immigrants | Micronesia | 0.3 /100 | #273 | Tragic 12.7% |
| Bermudans | 0.3 /100 | #274 | Tragic 12.7% |
| Central American Indians | 0.3 /100 | #275 | Tragic 12.7% |
| Spaniards | 0.2 /100 | #276 | Tragic 12.7% |
| Dominicans | 0.2 /100 | #277 | Tragic 12.7% |
| Lumbee | 0.2 /100 | #278 | Tragic 12.7% |
| Immigrants | Dominican Republic | 0.2 /100 | #279 | Tragic 12.7% |
Demographics Similar to Argentineans by Divorced or Separated
In terms of divorced or separated, the demographic groups most similar to Argentineans are Danish (11.9%, a difference of 0.020%), Carpatho Rusyn (11.9%, a difference of 0.020%), Alsatian (11.9%, a difference of 0.080%), Immigrants from Netherlands (11.9%, a difference of 0.080%), and Australian (11.9%, a difference of 0.10%).
| Demographics | Rating | Rank | Divorced or Separated |
| South Africans | 88.9 /100 | #127 | Excellent 11.8% |
| Immigrants | Ecuador | 88.9 /100 | #128 | Excellent 11.8% |
| Immigrants | St. Vincent and the Grenadines | 88.4 /100 | #129 | Excellent 11.8% |
| Immigrants | Austria | 88.2 /100 | #130 | Excellent 11.8% |
| Immigrants | Cambodia | 88.2 /100 | #131 | Excellent 11.8% |
| Immigrants | Afghanistan | 87.9 /100 | #132 | Excellent 11.8% |
| New Zealanders | 87.5 /100 | #133 | Excellent 11.9% |
| Argentineans | 85.1 /100 | #134 | Excellent 11.9% |
| Danes | 84.8 /100 | #135 | Excellent 11.9% |
| Carpatho Rusyns | 84.8 /100 | #136 | Excellent 11.9% |
| Alsatians | 84.0 /100 | #137 | Excellent 11.9% |
| Immigrants | Netherlands | 83.9 /100 | #138 | Excellent 11.9% |
| Australians | 83.6 /100 | #139 | Excellent 11.9% |
| Lebanese | 83.4 /100 | #140 | Excellent 11.9% |
| Immigrants | Morocco | 82.9 /100 | #141 | Excellent 11.9% |