Iraqi vs Argentinean Divorced or Separated
COMPARE
Iraqi
Argentinean
Divorced or Separated
Divorced or Separated Comparison
Iraqis
Argentineans
11.8%
DIVORCED OR SEPARATED
94.6/ 100
METRIC RATING
120th/ 347
METRIC RANK
11.9%
DIVORCED OR SEPARATED
85.1/ 100
METRIC RATING
134th/ 347
METRIC RANK
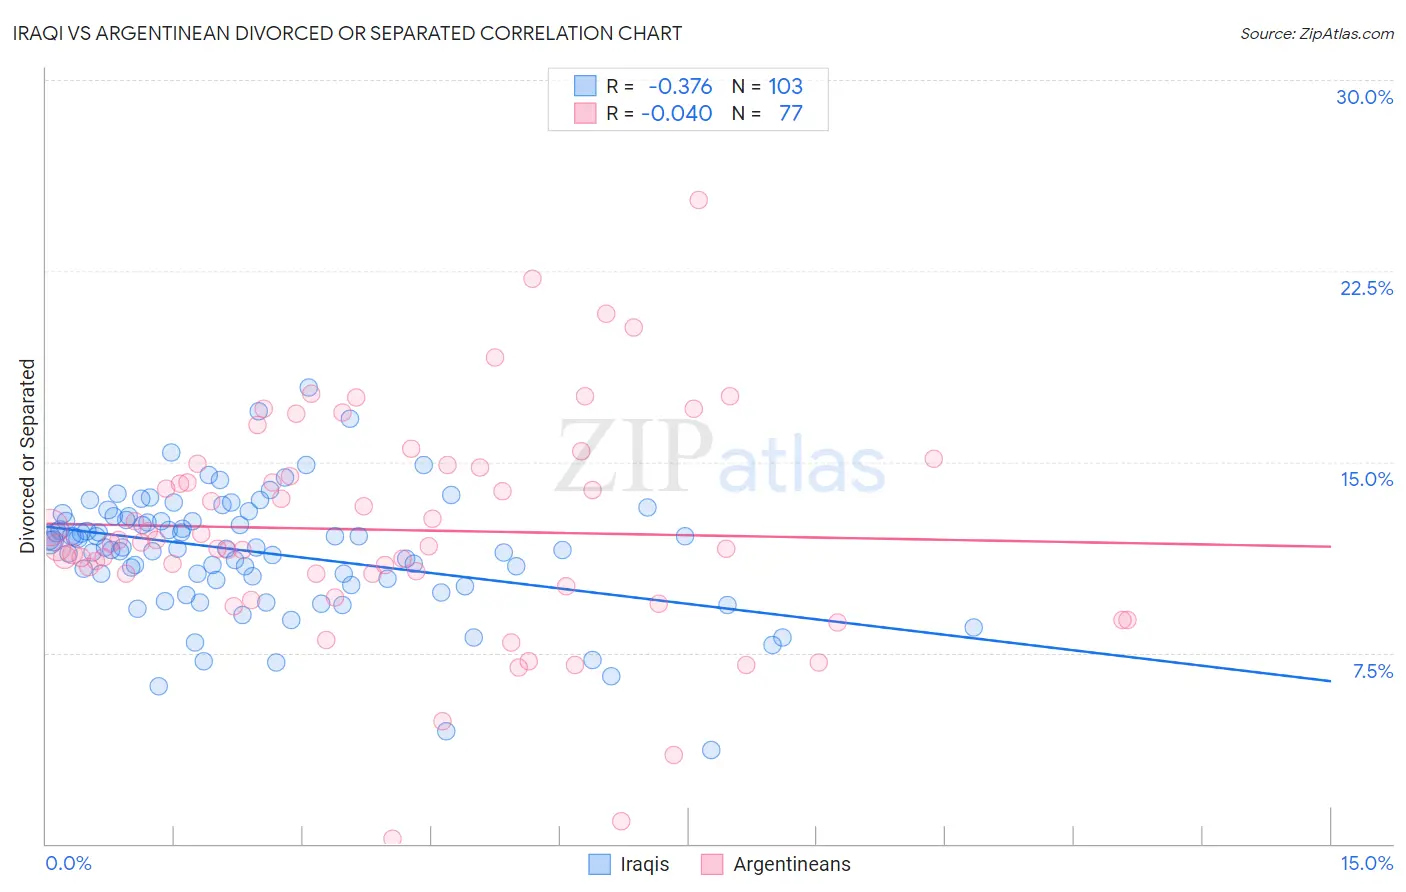
Iraqi vs Argentinean Divorced or Separated Correlation Chart
The statistical analysis conducted on geographies consisting of 170,608,468 people shows a mild negative correlation between the proportion of Iraqis and percentage of population currently divorced or separated in the United States with a correlation coefficient (R) of -0.376 and weighted average of 11.8%. Similarly, the statistical analysis conducted on geographies consisting of 297,042,213 people shows no correlation between the proportion of Argentineans and percentage of population currently divorced or separated in the United States with a correlation coefficient (R) of -0.040 and weighted average of 11.9%, a difference of 0.99%.
Divorced or Separated Correlation Summary
| Measurement | Iraqi | Argentinean |
| Minimum | 3.7% | 0.20% |
| Maximum | 17.9% | 25.3% |
| Range | 14.2% | 25.1% |
| Mean | 11.4% | 12.3% |
| Median | 11.7% | 11.8% |
| Interquartile 25% (IQ1) | 10.4% | 10.3% |
| Interquartile 75% (IQ3) | 12.7% | 14.8% |
| Interquartile Range (IQR) | 2.4% | 4.5% |
| Standard Deviation (Sample) | 2.4% | 4.3% |
| Standard Deviation (Population) | 2.4% | 4.3% |
Demographics Similar to Iraqis and Argentineans by Divorced or Separated
In terms of divorced or separated, the demographic groups most similar to Iraqis are Romanian (11.8%, a difference of 0.010%), Syrian (11.7%, a difference of 0.090%), Immigrants from Uganda (11.7%, a difference of 0.13%), Ecuadorian (11.7%, a difference of 0.13%), and Menominee (11.8%, a difference of 0.13%). Similarly, the demographic groups most similar to Argentineans are Danish (11.9%, a difference of 0.020%), Carpatho Rusyn (11.9%, a difference of 0.020%), Alsatian (11.9%, a difference of 0.080%), New Zealander (11.9%, a difference of 0.18%), and Immigrants from Afghanistan (11.8%, a difference of 0.21%).
| Demographics | Rating | Rank | Divorced or Separated |
| Immigrants | Uganda | 95.3 /100 | #117 | Exceptional 11.7% |
| Ecuadorians | 95.3 /100 | #118 | Exceptional 11.7% |
| Syrians | 95.1 /100 | #119 | Exceptional 11.7% |
| Iraqis | 94.6 /100 | #120 | Exceptional 11.8% |
| Romanians | 94.5 /100 | #121 | Exceptional 11.8% |
| Menominee | 93.8 /100 | #122 | Exceptional 11.8% |
| Immigrants | Immigrants | 93.7 /100 | #123 | Exceptional 11.8% |
| Ugandans | 93.1 /100 | #124 | Exceptional 11.8% |
| Ukrainians | 92.3 /100 | #125 | Exceptional 11.8% |
| South American Indians | 92.1 /100 | #126 | Exceptional 11.8% |
| South Africans | 88.9 /100 | #127 | Excellent 11.8% |
| Immigrants | Ecuador | 88.9 /100 | #128 | Excellent 11.8% |
| Immigrants | St. Vincent and the Grenadines | 88.4 /100 | #129 | Excellent 11.8% |
| Immigrants | Austria | 88.2 /100 | #130 | Excellent 11.8% |
| Immigrants | Cambodia | 88.2 /100 | #131 | Excellent 11.8% |
| Immigrants | Afghanistan | 87.9 /100 | #132 | Excellent 11.8% |
| New Zealanders | 87.5 /100 | #133 | Excellent 11.9% |
| Argentineans | 85.1 /100 | #134 | Excellent 11.9% |
| Danes | 84.8 /100 | #135 | Excellent 11.9% |
| Carpatho Rusyns | 84.8 /100 | #136 | Excellent 11.9% |
| Alsatians | 84.0 /100 | #137 | Excellent 11.9% |