Mexican American Indian vs Argentinean Divorced or Separated

COMPARE

Mexican American Indian
Race
Ancestry
AfghanAfricanAlaska NativeAlaskan AthabascanAlbanianAleutAlsatianAmericanApacheArabArapahoArmenianAssyrian/Chaldean/SyriacAustralianAustrianBahamianBangladeshiBarbadianBasqueBelgianBelizeanBermudanBhutaneseBlackfeetBolivianBrazilianBritishBritish West IndianBulgarianBurmeseCajunCambodianCanadianCape VerdeanCarpatho RusynCelticCentral AmericanCentral American IndianCherokeeCheyenneChickasawChileanChineseChippewaChoctawColombianColvilleComancheCosta RicanCreeCreekCroatianCrowCubanCypriotCzechCzechoslovakianDanishDelawareDominicanDutchDutch West IndianEastern EuropeanEcuadorianEgyptianEnglishEstonianEthiopianEuropeanFijianFilipinoFinnishFrenchFrench American IndianFrench CanadianGermanGerman RussianGhanaianGreekGuamanian/ChamorroGuatemalanGuyaneseHaitianHmongHonduranHopiHoumaHungarianIcelanderIndian (Asian)IndonesianInupiatIranianIraqiIrishIroquoisIsraeliItalianJamaicanJapaneseJordanianKenyanKiowaKoreanLaotianLatvianLebaneseLiberianLithuanianLumbeeLuxembourgerMacedonianMalaysianMalteseMarshalleseMenomineeMexicanMexican American IndianMongolianMoroccanNative HawaiianNavajoNepaleseNew ZealanderNicaraguanNigerianNorthern EuropeanNorwegianOkinawanOsageOttawaPaiutePakistaniPalestinianPanamanianParaguayanPennsylvania GermanPeruvianPimaPolishPortuguesePotawatomiPuebloPuerto RicanPuget Sound SalishRomanianRussianSalvadoranSamoanScandinavianScotch-IrishScottishSeminoleSenegaleseSerbianShoshoneSierra LeoneanSiouxSlavicSlovakSloveneSomaliSouth AfricanSouth AmericanSouth American IndianSoviet UnionSpaniardSpanishSpanish AmericanSpanish American IndianSri LankanSubsaharan AfricanSudaneseSwedishSwissSyrianTaiwaneseThaiTlingit-HaidaTohono O'OdhamTonganTrinidadian and TobagonianTsimshianTurkishU.S. Virgin IslanderUgandanUkrainianUruguayanUteVenezuelanVietnameseWelshWest IndianYakamaYaquiYugoslavianYumanYup'ikZimbabwean
Immigration
NonimmigrantsImmigrantsAfghanistanAfricaAlbaniaArgentinaArmeniaAsiaAustraliaAustriaBahamasBangladeshBarbadosBelarusBelgiumBelizeBoliviaBosnia and HerzegovinaBrazilBulgariaBurma/MyanmarCabo VerdeCambodiaCameroonCanadaCaribbeanCentral AmericaChileChinaColombiaCongoCosta RicaCroatiaCubaCzechoslovakiaDenmarkDominicaDominican RepublicEastern AfricaEastern AsiaEastern EuropeEcuadorEgyptEl SalvadorEnglandEritreaEthiopiaEuropeFijiFranceGermanyGhanaGreeceGrenadaGuatemalaGuyanaHaitiHondurasHong KongHungaryIndiaIndonesiaIranIraqIrelandIsraelItalyJamaicaJapanJordanKazakhstanKenyaKoreaKuwaitLaosLatin AmericaLatviaLebanonLiberiaLithuaniaMalaysiaMexicoMicronesiaMiddle AfricaMoldovaMoroccoNepalNetherlandsNicaraguaNigeriaNorth AmericaNorth MacedoniaNorthern AfricaNorthern EuropeNorwayOceaniaPakistanPanamaPeruPhilippinesPolandPortugalRomaniaRussiaSaudi ArabiaScotlandSenegalSerbiaSierra LeoneSingaporeSomaliaSouth AfricaSouth AmericaSouth Central AsiaSouth Eastern AsiaSouthern EuropeSpainSri LankaSt. Vincent and the GrenadinesSudanSwedenSwitzerlandSyriaTaiwanThailandTrinidad and TobagoTurkeyUgandaUkraineUruguayUzbekistanVenezuelaVietnamWest IndiesWestern AfricaWestern AsiaWestern EuropeYemenZaireZimbabweAzores
Argentinean
Race
Ancestry
AfghanAfricanAlaska NativeAlaskan AthabascanAlbanianAleutAlsatianAmericanApacheArabArapahoArgentineanArmenianAssyrian/Chaldean/SyriacAustralianAustrianBahamianBangladeshiBarbadianBasqueBelgianBelizeanBermudanBhutaneseBlackfeetBolivianBrazilianBritishBritish West IndianBulgarianBurmeseCajunCambodianCanadianCape VerdeanCarpatho RusynCelticCentral AmericanCentral American IndianCherokeeCheyenneChickasawChileanChineseChippewaChoctawColombianColvilleComancheCosta RicanCreeCreekCroatianCrowCubanCypriotCzechCzechoslovakianDanishDelawareDominicanDutchDutch West IndianEastern EuropeanEcuadorianEgyptianEnglishEstonianEthiopianEuropeanFijianFilipinoFinnishFrenchFrench American IndianFrench CanadianGermanGerman RussianGhanaianGreekGuamanian/ChamorroGuatemalanGuyaneseHaitianHmongHonduranHopiHoumaHungarianIcelanderIndian (Asian)IndonesianInupiatIranianIraqiIrishIroquoisIsraeliItalianJamaicanJapaneseJordanianKenyanKiowaKoreanLaotianLatvianLebaneseLiberianLithuanianLumbeeLuxembourgerMacedonianMalaysianMalteseMarshalleseMenomineeMexicanMongolianMoroccanNative HawaiianNavajoNepaleseNew ZealanderNicaraguanNigerianNorthern EuropeanNorwegianOkinawanOsageOttawaPaiutePakistaniPalestinianPanamanianParaguayanPennsylvania GermanPeruvianPimaPolishPortuguesePotawatomiPuebloPuerto RicanPuget Sound SalishRomanianRussianSalvadoranSamoanScandinavianScotch-IrishScottishSeminoleSenegaleseSerbianShoshoneSierra LeoneanSiouxSlavicSlovakSloveneSomaliSouth AfricanSouth AmericanSouth American IndianSoviet UnionSpaniardSpanishSpanish AmericanSpanish American IndianSri LankanSubsaharan AfricanSudaneseSwedishSwissSyrianTaiwaneseThaiTlingit-HaidaTohono O'OdhamTonganTrinidadian and TobagonianTsimshianTurkishU.S. Virgin IslanderUgandanUkrainianUruguayanUteVenezuelanVietnameseWelshWest IndianYakamaYaquiYugoslavianYumanYup'ikZimbabwean
Immigration
NonimmigrantsImmigrantsAfghanistanAfricaAlbaniaArgentinaArmeniaAsiaAustraliaAustriaBahamasBangladeshBarbadosBelarusBelgiumBelizeBoliviaBosnia and HerzegovinaBrazilBulgariaBurma/MyanmarCabo VerdeCambodiaCameroonCanadaCaribbeanCentral AmericaChileChinaColombiaCongoCosta RicaCroatiaCubaCzechoslovakiaDenmarkDominicaDominican RepublicEastern AfricaEastern AsiaEastern EuropeEcuadorEgyptEl SalvadorEnglandEritreaEthiopiaEuropeFijiFranceGermanyGhanaGreeceGrenadaGuatemalaGuyanaHaitiHondurasHong KongHungaryIndiaIndonesiaIranIraqIrelandIsraelItalyJamaicaJapanJordanKazakhstanKenyaKoreaKuwaitLaosLatin AmericaLatviaLebanonLiberiaLithuaniaMalaysiaMexicoMicronesiaMiddle AfricaMoldovaMoroccoNepalNetherlandsNicaraguaNigeriaNorth AmericaNorth MacedoniaNorthern AfricaNorthern EuropeNorwayOceaniaPakistanPanamaPeruPhilippinesPolandPortugalRomaniaRussiaSaudi ArabiaScotlandSenegalSerbiaSierra LeoneSingaporeSomaliaSouth AfricaSouth AmericaSouth Central AsiaSouth Eastern AsiaSouthern EuropeSpainSri LankaSt. Vincent and the GrenadinesSudanSwedenSwitzerlandSyriaTaiwanThailandTrinidad and TobagoTurkeyUgandaUkraineUruguayUzbekistanVenezuelaVietnamWest IndiesWestern AfricaWestern AsiaWestern EuropeYemenZaireZimbabweAzores
Divorced or Separated
Income
Poverty
Unemployment
Labor Participation
Family Structure
Vehicle Availability
Education Level
Disability

Divorced or Separated Comparison

Mexican American Indians

Argentineans

Average
Excellent
12.0%
DIVORCED OR SEPARATED
55.8/ 100
METRIC RATING
170th/ 347
METRIC RANK
11.9%
DIVORCED OR SEPARATED
85.1/ 100
METRIC RATING
134th/ 347
METRIC RANK

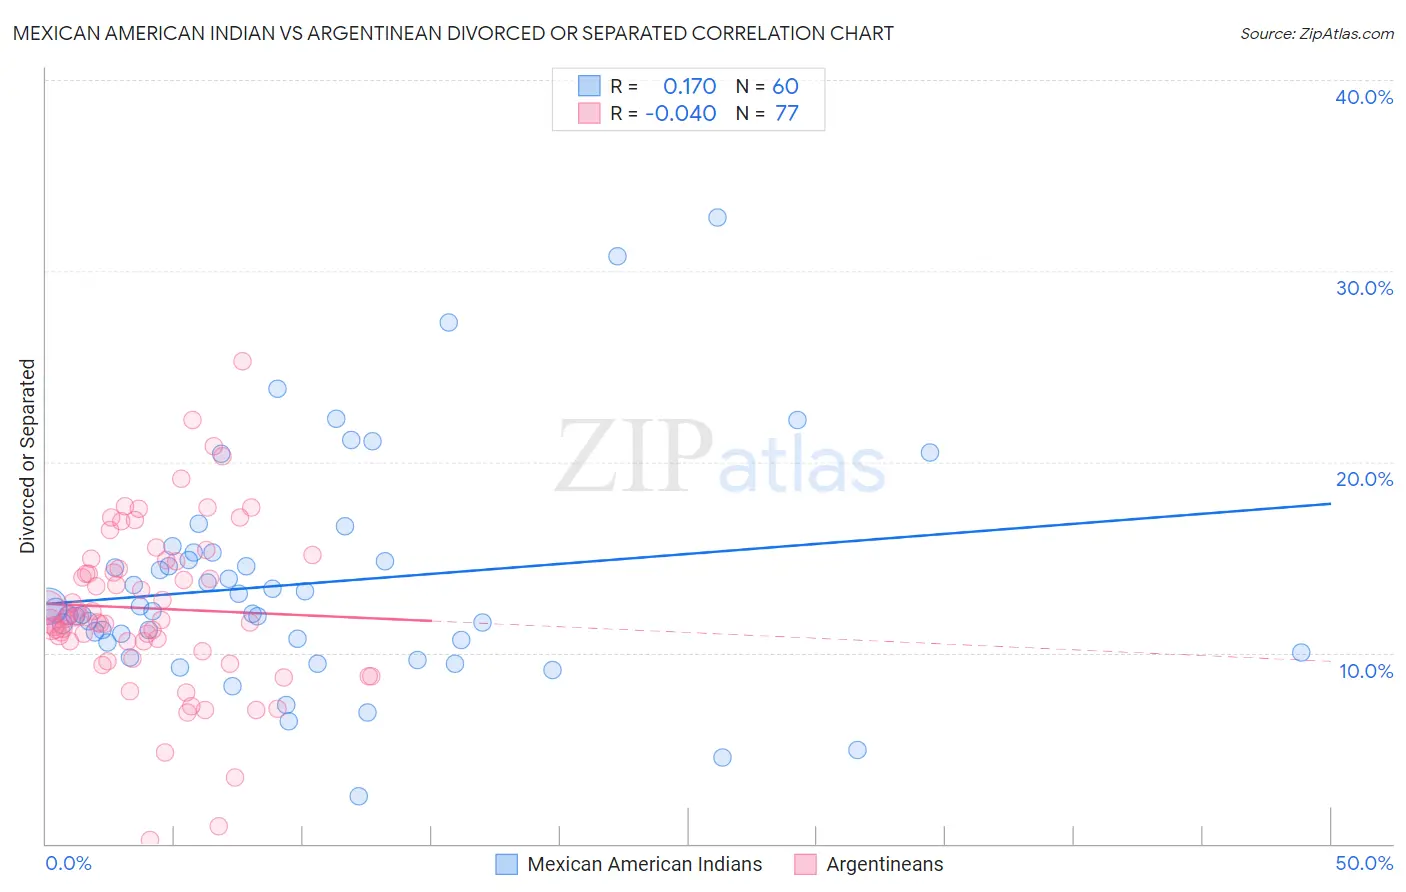
Mexican American Indian vs Argentinean Divorced or Separated Correlation Chart

The statistical analysis conducted on geographies consisting of 317,554,193 people shows a poor positive correlation between the proportion of Mexican American Indians and percentage of population currently divorced or separated in the United States with a correlation coefficient (R) of 0.170 and weighted average of 12.0%. Similarly, the statistical analysis conducted on geographies consisting of 297,042,213 people shows no correlation between the proportion of Argentineans and percentage of population currently divorced or separated in the United States with a correlation coefficient (R) of -0.040 and weighted average of 11.9%, a difference of 1.3%.
Mexican American Indian vs Argentinean Divorced or Separated

Divorced or Separated Correlation Summary

MeasurementMexican American IndianArgentinean
Minimum2.5%0.20%
Maximum32.8%25.3%
Range30.3%25.1%
Mean13.6%12.3%
Median12.2%11.8%
Interquartile 25% (IQ1)10.6%10.3%
Interquartile 75% (IQ3)15.0%14.8%
Interquartile Range (IQR)4.4%4.5%
Standard Deviation (Sample)5.8%4.3%
Standard Deviation (Population)5.8%4.3%

Similar Demographics by Divorced or Separated

Demographics Similar to Mexican American Indians by Divorced or Separated

In terms of divorced or separated, the demographic groups most similar to Mexican American Indians are Serbian (12.0%, a difference of 0.040%), Immigrants from Peru (12.0%, a difference of 0.040%), Costa Rican (12.0%, a difference of 0.090%), Immigrants from Mexico (12.0%, a difference of 0.090%), and Ethiopian (12.0%, a difference of 0.10%).
DemographicsRating | RankDivorced or Separated
Navajo
63.9
/100
|
#163
Good
12.0%
Swiss
63.6
/100
|
#164
Good
12.0%
German Russians
61.8
/100
|
#165
Good
12.0%
Tohono O'odham
60.4
/100
|
#166
Good
12.0%
Ethiopians
58.5
/100
|
#167
Average
12.0%
Serbians
57.1
/100
|
#168
Average
12.0%
Immigrants | Peru
57.0
/100
|
#169
Average
12.0%
Mexican American Indians
55.8
/100
|
#170
Average
12.0%
Costa Ricans
53.3
/100
|
#171
Average
12.0%
Immigrants | Mexico
53.2
/100
|
#172
Average
12.0%
Immigrants | Moldova
50.4
/100
|
#173
Average
12.1%
Hawaiians
50.0
/100
|
#174
Average
12.1%
Immigrants | Sierra Leone
50.0
/100
|
#175
Average
12.1%
Pennsylvania Germans
48.9
/100
|
#176
Average
12.1%
Brazilians
47.7
/100
|
#177
Average
12.1%

Demographics Similar to Argentineans by Divorced or Separated

In terms of divorced or separated, the demographic groups most similar to Argentineans are Danish (11.9%, a difference of 0.020%), Carpatho Rusyn (11.9%, a difference of 0.020%), Alsatian (11.9%, a difference of 0.080%), Immigrants from Netherlands (11.9%, a difference of 0.080%), and Australian (11.9%, a difference of 0.10%).
DemographicsRating | RankDivorced or Separated
South Africans
88.9
/100
|
#127
Excellent
11.8%
Immigrants | Ecuador
88.9
/100
|
#128
Excellent
11.8%
Immigrants | St. Vincent and the Grenadines
88.4
/100
|
#129
Excellent
11.8%
Immigrants | Austria
88.2
/100
|
#130
Excellent
11.8%
Immigrants | Cambodia
88.2
/100
|
#131
Excellent
11.8%
Immigrants | Afghanistan
87.9
/100
|
#132
Excellent
11.8%
New Zealanders
87.5
/100
|
#133
Excellent
11.9%
Argentineans
85.1
/100
|
#134
Excellent
11.9%
Danes
84.8
/100
|
#135
Excellent
11.9%
Carpatho Rusyns
84.8
/100
|
#136
Excellent
11.9%
Alsatians
84.0
/100
|
#137
Excellent
11.9%
Immigrants | Netherlands
83.9
/100
|
#138
Excellent
11.9%
Australians
83.6
/100
|
#139
Excellent
11.9%
Lebanese
83.4
/100
|
#140
Excellent
11.9%
Immigrants | Morocco
82.9
/100
|
#141
Excellent
11.9%