Assyrian/Chaldean/Syriac vs Immigrants from Turkey Currently Married
COMPARE
Assyrian/Chaldean/Syriac
Immigrants from Turkey
Currently Married
Currently Married Comparison
Assyrians/Chaldeans/Syriacs
Immigrants from Turkey
50.8%
CURRENTLY MARRIED
100.0/ 100
METRIC RATING
3rd/ 347
METRIC RANK
47.0%
CURRENTLY MARRIED
70.0/ 100
METRIC RATING
150th/ 347
METRIC RANK
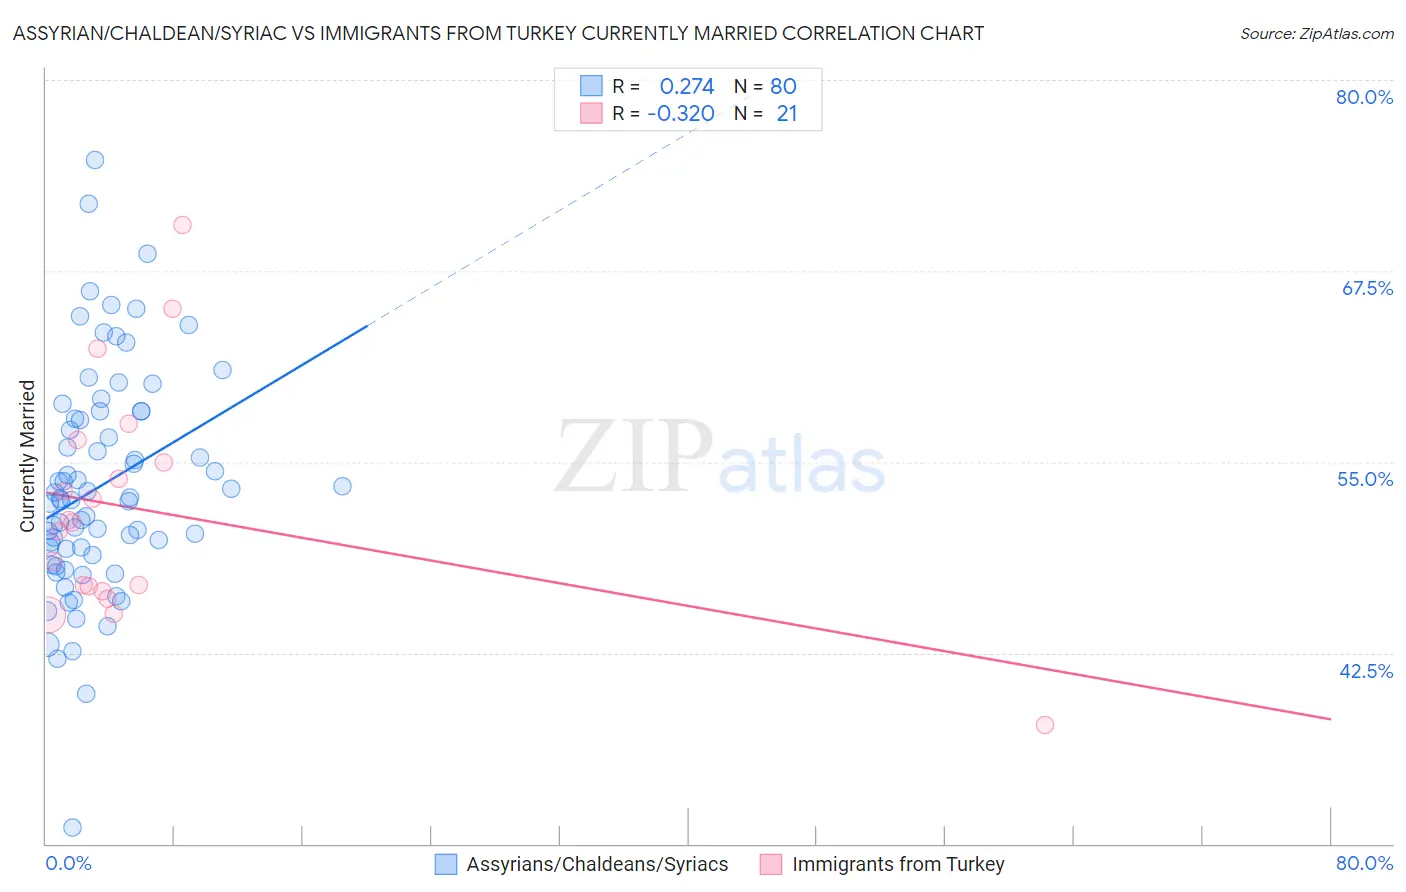
Assyrian/Chaldean/Syriac vs Immigrants from Turkey Currently Married Correlation Chart
The statistical analysis conducted on geographies consisting of 110,318,125 people shows a weak positive correlation between the proportion of Assyrians/Chaldeans/Syriacs and percentage of population currently married in the United States with a correlation coefficient (R) of 0.274 and weighted average of 50.8%. Similarly, the statistical analysis conducted on geographies consisting of 223,037,239 people shows a mild negative correlation between the proportion of Immigrants from Turkey and percentage of population currently married in the United States with a correlation coefficient (R) of -0.320 and weighted average of 47.0%, a difference of 8.1%.
Currently Married Correlation Summary
| Measurement | Assyrian/Chaldean/Syriac | Immigrants from Turkey |
| Minimum | 31.0% | 37.8% |
| Maximum | 74.8% | 70.5% |
| Range | 43.8% | 32.7% |
| Mean | 53.4% | 51.8% |
| Median | 52.6% | 51.0% |
| Interquartile 25% (IQ1) | 49.1% | 46.7% |
| Interquartile 75% (IQ3) | 58.1% | 55.7% |
| Interquartile Range (IQR) | 8.9% | 9.0% |
| Standard Deviation (Sample) | 7.4% | 7.6% |
| Standard Deviation (Population) | 7.3% | 7.4% |
Similar Demographics by Currently Married
Demographics Similar to Assyrians/Chaldeans/Syriacs by Currently Married
In terms of currently married, the demographic groups most similar to Assyrians/Chaldeans/Syriacs are Immigrants from Taiwan (50.7%, a difference of 0.080%), Thai (50.9%, a difference of 0.18%), Danish (50.5%, a difference of 0.63%), Norwegian (50.2%, a difference of 1.2%), and Immigrants from South Central Asia (50.0%, a difference of 1.5%).
| Demographics | Rating | Rank | Currently Married |
| Immigrants | India | 100.0 /100 | #1 | Exceptional 51.8% |
| Thais | 100.0 /100 | #2 | Exceptional 50.9% |
| Assyrians/Chaldeans/Syriacs | 100.0 /100 | #3 | Exceptional 50.8% |
| Immigrants | Taiwan | 100.0 /100 | #4 | Exceptional 50.7% |
| Danes | 100.0 /100 | #5 | Exceptional 50.5% |
| Norwegians | 100.0 /100 | #6 | Exceptional 50.2% |
| Immigrants | South Central Asia | 100.0 /100 | #7 | Exceptional 50.0% |
| Swedes | 100.0 /100 | #8 | Exceptional 50.0% |
| Czechs | 99.9 /100 | #9 | Exceptional 49.9% |
| Filipinos | 99.9 /100 | #10 | Exceptional 49.7% |
| English | 99.9 /100 | #11 | Exceptional 49.7% |
| Swiss | 99.9 /100 | #12 | Exceptional 49.7% |
| Dutch | 99.9 /100 | #13 | Exceptional 49.6% |
| Germans | 99.9 /100 | #14 | Exceptional 49.6% |
| Pennsylvania Germans | 99.9 /100 | #15 | Exceptional 49.6% |
Demographics Similar to Immigrants from Turkey by Currently Married
In terms of currently married, the demographic groups most similar to Immigrants from Turkey are Zimbabwean (47.0%, a difference of 0.0%), Cambodian (47.0%, a difference of 0.010%), Chilean (47.0%, a difference of 0.010%), Immigrants from Serbia (47.0%, a difference of 0.050%), and Immigrants from Venezuela (47.0%, a difference of 0.060%).
| Demographics | Rating | Rank | Currently Married |
| Guamanians/Chamorros | 74.2 /100 | #143 | Good 47.1% |
| Hmong | 73.4 /100 | #144 | Good 47.1% |
| Immigrants | South Eastern Asia | 72.9 /100 | #145 | Good 47.1% |
| Carpatho Rusyns | 72.6 /100 | #146 | Good 47.0% |
| Immigrants | Argentina | 72.0 /100 | #147 | Good 47.0% |
| Cambodians | 70.4 /100 | #148 | Good 47.0% |
| Zimbabweans | 70.1 /100 | #149 | Good 47.0% |
| Immigrants | Turkey | 70.0 /100 | #150 | Good 47.0% |
| Chileans | 69.8 /100 | #151 | Good 47.0% |
| Immigrants | Serbia | 68.8 /100 | #152 | Good 47.0% |
| Immigrants | Venezuela | 68.6 /100 | #153 | Good 47.0% |
| Albanians | 68.6 /100 | #154 | Good 47.0% |
| Arabs | 68.6 /100 | #155 | Good 47.0% |
| Spanish | 68.1 /100 | #156 | Good 47.0% |
| Immigrants | Switzerland | 67.8 /100 | #157 | Good 46.9% |