Inupiat vs Immigrants from Lebanon Currently Married
COMPARE
Inupiat
Immigrants from Lebanon
Currently Married
Currently Married Comparison
Inupiat
Immigrants from Lebanon
41.3%
CURRENTLY MARRIED
0.0/ 100
METRIC RATING
315th/ 347
METRIC RANK
48.2%
CURRENTLY MARRIED
97.6/ 100
METRIC RATING
72nd/ 347
METRIC RANK
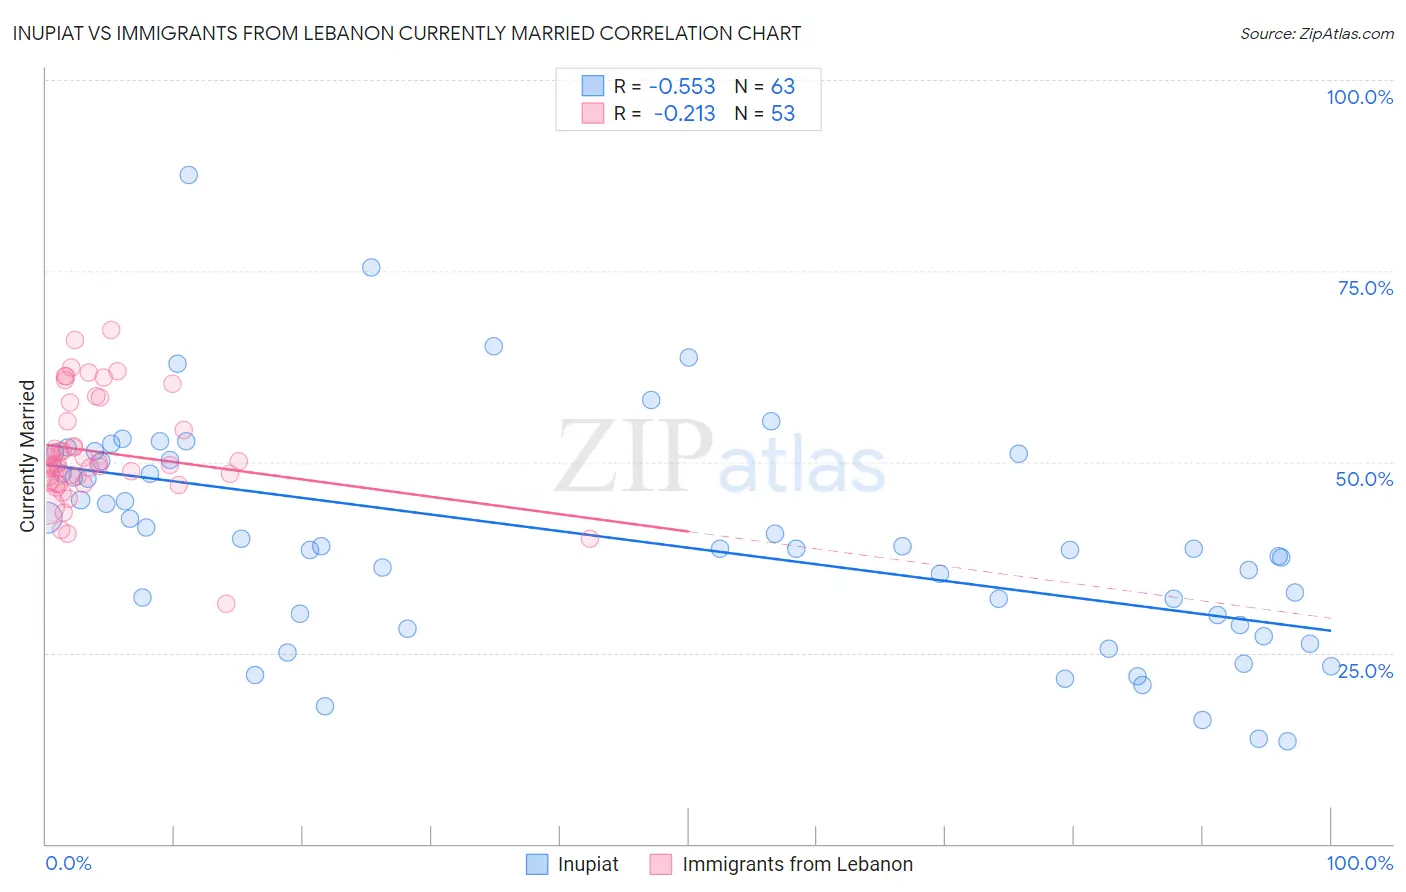
Inupiat vs Immigrants from Lebanon Currently Married Correlation Chart
The statistical analysis conducted on geographies consisting of 96,349,193 people shows a substantial negative correlation between the proportion of Inupiat and percentage of population currently married in the United States with a correlation coefficient (R) of -0.553 and weighted average of 41.3%. Similarly, the statistical analysis conducted on geographies consisting of 217,155,711 people shows a weak negative correlation between the proportion of Immigrants from Lebanon and percentage of population currently married in the United States with a correlation coefficient (R) of -0.213 and weighted average of 48.2%, a difference of 16.8%.
Currently Married Correlation Summary
| Measurement | Inupiat | Immigrants from Lebanon |
| Minimum | 13.5% | 31.4% |
| Maximum | 87.5% | 67.2% |
| Range | 74.0% | 35.8% |
| Mean | 40.0% | 51.3% |
| Median | 38.7% | 49.7% |
| Interquartile 25% (IQ1) | 28.7% | 47.4% |
| Interquartile 75% (IQ3) | 50.3% | 56.5% |
| Interquartile Range (IQR) | 21.6% | 9.2% |
| Standard Deviation (Sample) | 14.7% | 7.0% |
| Standard Deviation (Population) | 14.6% | 6.9% |
Similar Demographics by Currently Married
Demographics Similar to Inupiat by Currently Married
In terms of currently married, the demographic groups most similar to Inupiat are Immigrants from Caribbean (41.3%, a difference of 0.060%), Haitian (41.3%, a difference of 0.080%), West Indian (41.3%, a difference of 0.090%), Jamaican (41.4%, a difference of 0.16%), and Bahamian (41.2%, a difference of 0.26%).
| Demographics | Rating | Rank | Currently Married |
| Immigrants | Belize | 0.0 /100 | #308 | Tragic 41.8% |
| Immigrants | Liberia | 0.0 /100 | #309 | Tragic 41.8% |
| Guyanese | 0.0 /100 | #310 | Tragic 41.6% |
| Trinidadians and Tobagonians | 0.0 /100 | #311 | Tragic 41.5% |
| Somalis | 0.0 /100 | #312 | Tragic 41.5% |
| Jamaicans | 0.0 /100 | #313 | Tragic 41.4% |
| West Indians | 0.0 /100 | #314 | Tragic 41.3% |
| Inupiat | 0.0 /100 | #315 | Tragic 41.3% |
| Immigrants | Caribbean | 0.0 /100 | #316 | Tragic 41.3% |
| Haitians | 0.0 /100 | #317 | Tragic 41.3% |
| Bahamians | 0.0 /100 | #318 | Tragic 41.2% |
| Immigrants | Somalia | 0.0 /100 | #319 | Tragic 41.2% |
| Immigrants | Jamaica | 0.0 /100 | #320 | Tragic 41.1% |
| Immigrants | Congo | 0.0 /100 | #321 | Tragic 41.1% |
| Immigrants | Haiti | 0.0 /100 | #322 | Tragic 41.0% |
Demographics Similar to Immigrants from Lebanon by Currently Married
In terms of currently married, the demographic groups most similar to Immigrants from Lebanon are Immigrants from Eastern Asia (48.2%, a difference of 0.020%), Estonian (48.2%, a difference of 0.050%), Immigrants from Belarus (48.1%, a difference of 0.12%), Macedonian (48.3%, a difference of 0.14%), and Basque (48.1%, a difference of 0.14%).
| Demographics | Rating | Rank | Currently Married |
| Ukrainians | 98.3 /100 | #65 | Exceptional 48.4% |
| Tongans | 98.2 /100 | #66 | Exceptional 48.3% |
| Slovaks | 98.2 /100 | #67 | Exceptional 48.3% |
| Immigrants | England | 98.2 /100 | #68 | Exceptional 48.3% |
| Canadians | 98.1 /100 | #69 | Exceptional 48.3% |
| Immigrants | Asia | 97.9 /100 | #70 | Exceptional 48.3% |
| Macedonians | 97.9 /100 | #71 | Exceptional 48.3% |
| Immigrants | Lebanon | 97.6 /100 | #72 | Exceptional 48.2% |
| Immigrants | Eastern Asia | 97.5 /100 | #73 | Exceptional 48.2% |
| Estonians | 97.4 /100 | #74 | Exceptional 48.2% |
| Immigrants | Belarus | 97.2 /100 | #75 | Exceptional 48.1% |
| Basques | 97.2 /100 | #76 | Exceptional 48.1% |
| Slovenes | 97.1 /100 | #77 | Exceptional 48.1% |
| Immigrants | Belgium | 97.1 /100 | #78 | Exceptional 48.1% |
| Immigrants | South Africa | 97.0 /100 | #79 | Exceptional 48.1% |