Cypriot vs Immigrants from Lebanon Currently Married
COMPARE
Cypriot
Immigrants from Lebanon
Currently Married
Currently Married Comparison
Cypriots
Immigrants from Lebanon
47.8%
CURRENTLY MARRIED
93.7/ 100
METRIC RATING
103rd/ 347
METRIC RANK
48.2%
CURRENTLY MARRIED
97.6/ 100
METRIC RATING
72nd/ 347
METRIC RANK
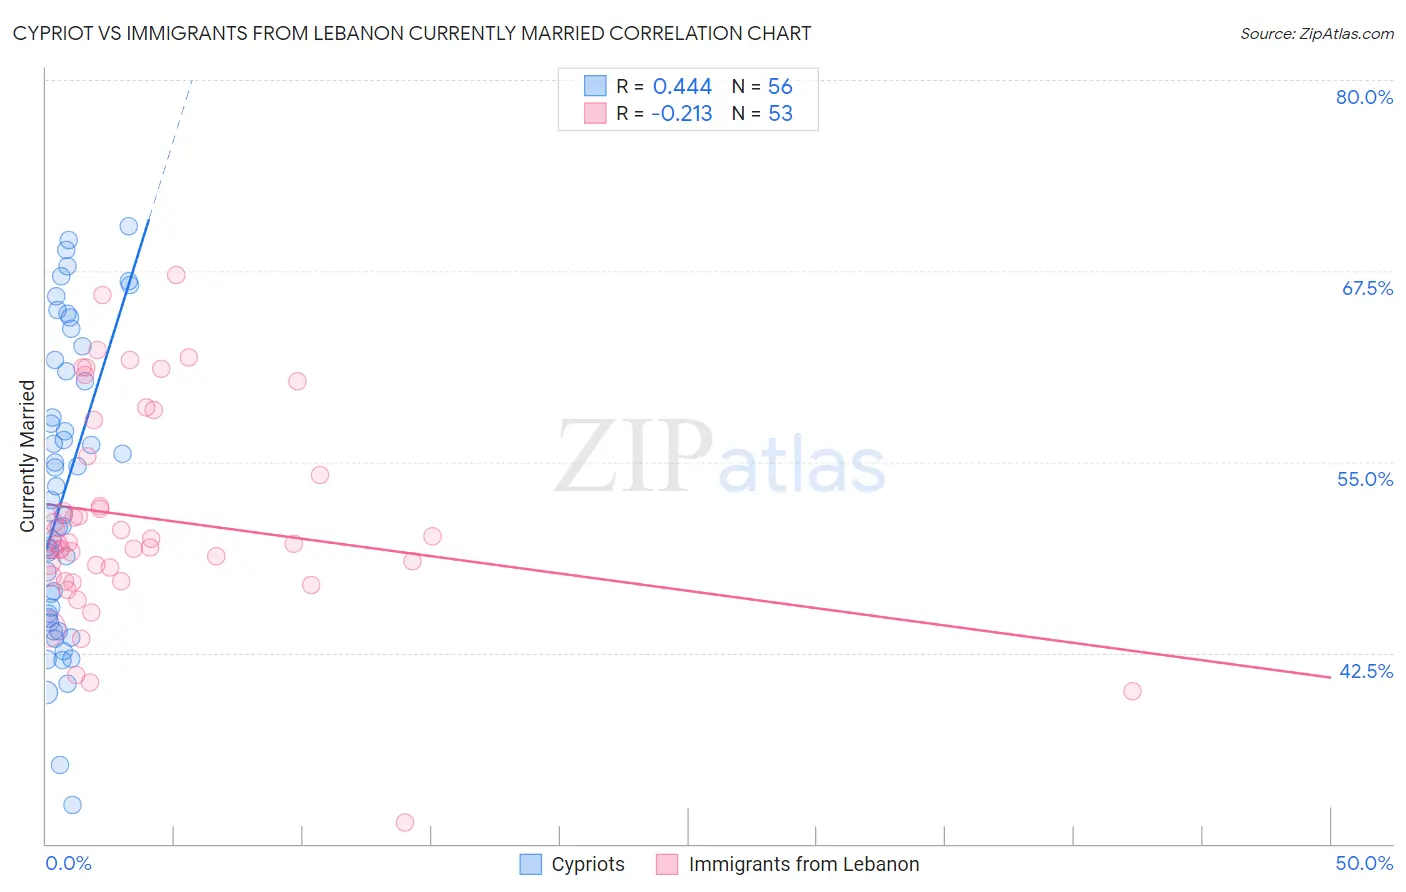
Cypriot vs Immigrants from Lebanon Currently Married Correlation Chart
The statistical analysis conducted on geographies consisting of 61,862,826 people shows a moderate positive correlation between the proportion of Cypriots and percentage of population currently married in the United States with a correlation coefficient (R) of 0.444 and weighted average of 47.8%. Similarly, the statistical analysis conducted on geographies consisting of 217,155,711 people shows a weak negative correlation between the proportion of Immigrants from Lebanon and percentage of population currently married in the United States with a correlation coefficient (R) of -0.213 and weighted average of 48.2%, a difference of 0.88%.
Currently Married Correlation Summary
| Measurement | Cypriot | Immigrants from Lebanon |
| Minimum | 32.6% | 31.4% |
| Maximum | 70.4% | 67.2% |
| Range | 37.8% | 35.8% |
| Mean | 53.2% | 51.3% |
| Median | 52.1% | 49.7% |
| Interquartile 25% (IQ1) | 44.9% | 47.4% |
| Interquartile 75% (IQ3) | 61.3% | 56.5% |
| Interquartile Range (IQR) | 16.4% | 9.2% |
| Standard Deviation (Sample) | 9.6% | 7.0% |
| Standard Deviation (Population) | 9.5% | 6.9% |
Similar Demographics by Currently Married
Demographics Similar to Cypriots by Currently Married
In terms of currently married, the demographic groups most similar to Cypriots are Serbian (47.8%, a difference of 0.020%), Turkish (47.8%, a difference of 0.030%), Immigrants from Germany (47.8%, a difference of 0.050%), Celtic (47.8%, a difference of 0.070%), and Immigrants from Singapore (47.8%, a difference of 0.070%).
| Demographics | Rating | Rank | Currently Married |
| Egyptians | 94.8 /100 | #96 | Exceptional 47.9% |
| Immigrants | Ukraine | 94.8 /100 | #97 | Exceptional 47.9% |
| Immigrants | China | 94.7 /100 | #98 | Exceptional 47.9% |
| Immigrants | Sweden | 94.3 /100 | #99 | Exceptional 47.8% |
| Celtics | 94.2 /100 | #100 | Exceptional 47.8% |
| Immigrants | Germany | 94.1 /100 | #101 | Exceptional 47.8% |
| Turks | 93.9 /100 | #102 | Exceptional 47.8% |
| Cypriots | 93.7 /100 | #103 | Exceptional 47.8% |
| Serbians | 93.6 /100 | #104 | Exceptional 47.8% |
| Immigrants | Singapore | 93.3 /100 | #105 | Exceptional 47.8% |
| Immigrants | Greece | 93.1 /100 | #106 | Exceptional 47.7% |
| Immigrants | Italy | 92.9 /100 | #107 | Exceptional 47.7% |
| Tsimshian | 92.4 /100 | #108 | Exceptional 47.7% |
| Immigrants | Egypt | 92.3 /100 | #109 | Exceptional 47.7% |
| Immigrants | Russia | 92.0 /100 | #110 | Exceptional 47.7% |
Demographics Similar to Immigrants from Lebanon by Currently Married
In terms of currently married, the demographic groups most similar to Immigrants from Lebanon are Immigrants from Eastern Asia (48.2%, a difference of 0.020%), Estonian (48.2%, a difference of 0.050%), Immigrants from Belarus (48.1%, a difference of 0.12%), Macedonian (48.3%, a difference of 0.14%), and Basque (48.1%, a difference of 0.14%).
| Demographics | Rating | Rank | Currently Married |
| Ukrainians | 98.3 /100 | #65 | Exceptional 48.4% |
| Tongans | 98.2 /100 | #66 | Exceptional 48.3% |
| Slovaks | 98.2 /100 | #67 | Exceptional 48.3% |
| Immigrants | England | 98.2 /100 | #68 | Exceptional 48.3% |
| Canadians | 98.1 /100 | #69 | Exceptional 48.3% |
| Immigrants | Asia | 97.9 /100 | #70 | Exceptional 48.3% |
| Macedonians | 97.9 /100 | #71 | Exceptional 48.3% |
| Immigrants | Lebanon | 97.6 /100 | #72 | Exceptional 48.2% |
| Immigrants | Eastern Asia | 97.5 /100 | #73 | Exceptional 48.2% |
| Estonians | 97.4 /100 | #74 | Exceptional 48.2% |
| Immigrants | Belarus | 97.2 /100 | #75 | Exceptional 48.1% |
| Basques | 97.2 /100 | #76 | Exceptional 48.1% |
| Slovenes | 97.1 /100 | #77 | Exceptional 48.1% |
| Immigrants | Belgium | 97.1 /100 | #78 | Exceptional 48.1% |
| Immigrants | South Africa | 97.0 /100 | #79 | Exceptional 48.1% |