Nigerian vs Immigrants from Eastern Africa Single Mother Households
COMPARE
Nigerian
Immigrants from Eastern Africa
Single Mother Households
Single Mother Households Comparison
Nigerians
Immigrants from Eastern Africa
7.7%
SINGLE MOTHER HOUSEHOLDS
0.0/ 100
METRIC RATING
283rd/ 347
METRIC RANK
6.8%
SINGLE MOTHER HOUSEHOLDS
4.4/ 100
METRIC RATING
218th/ 347
METRIC RANK
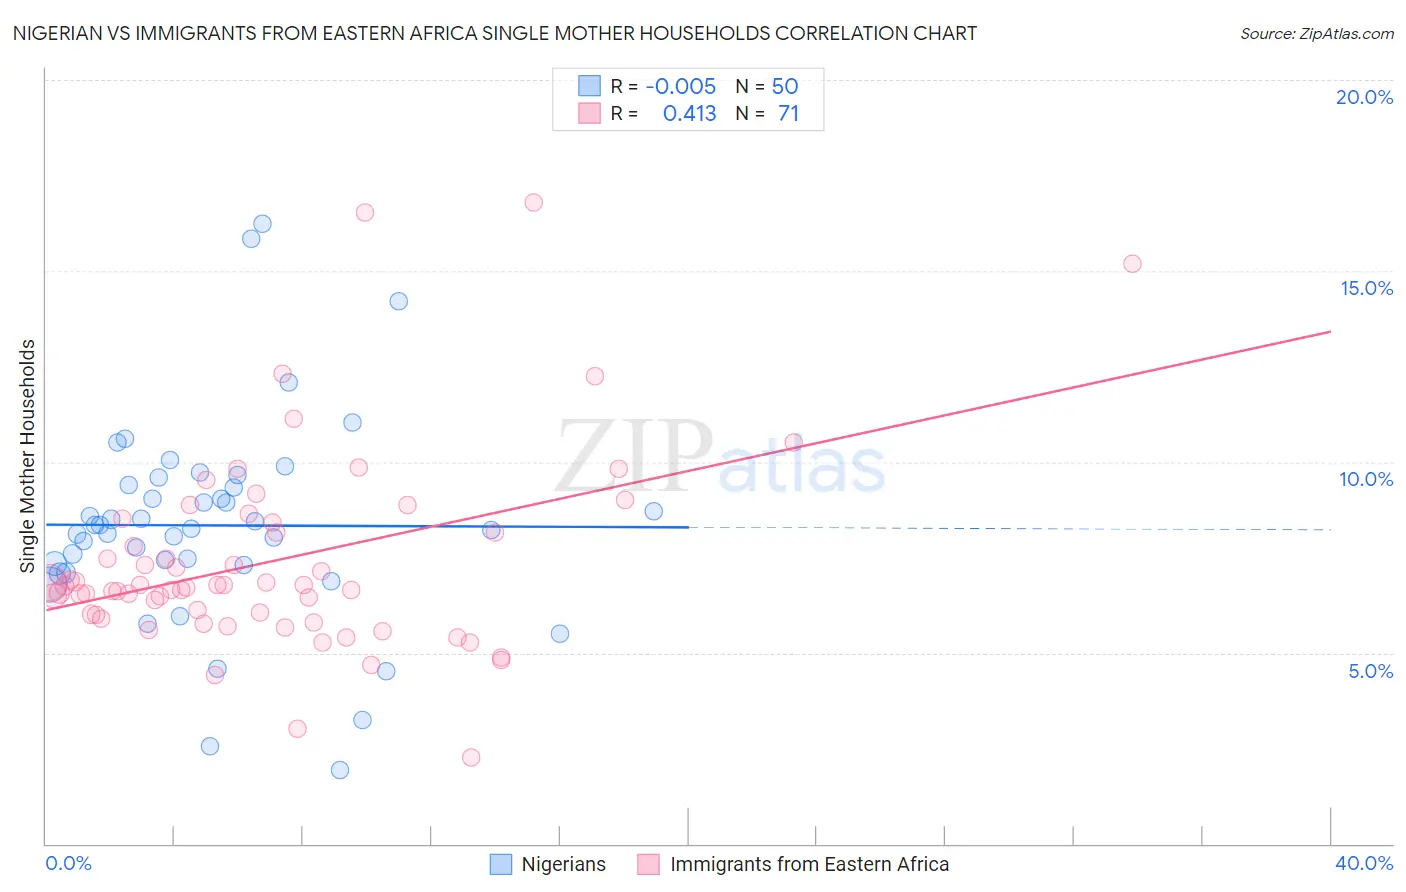
Nigerian vs Immigrants from Eastern Africa Single Mother Households Correlation Chart
The statistical analysis conducted on geographies consisting of 332,046,179 people shows no correlation between the proportion of Nigerians and percentage of single mother households in the United States with a correlation coefficient (R) of -0.005 and weighted average of 7.7%. Similarly, the statistical analysis conducted on geographies consisting of 354,507,775 people shows a moderate positive correlation between the proportion of Immigrants from Eastern Africa and percentage of single mother households in the United States with a correlation coefficient (R) of 0.413 and weighted average of 6.8%, a difference of 12.1%.
Single Mother Households Correlation Summary
| Measurement | Nigerian | Immigrants from Eastern Africa |
| Minimum | 1.9% | 2.3% |
| Maximum | 16.2% | 16.8% |
| Range | 14.3% | 14.5% |
| Mean | 8.3% | 7.4% |
| Median | 8.3% | 6.8% |
| Interquartile 25% (IQ1) | 7.3% | 6.0% |
| Interquartile 75% (IQ3) | 9.4% | 8.4% |
| Interquartile Range (IQR) | 2.1% | 2.4% |
| Standard Deviation (Sample) | 2.7% | 2.6% |
| Standard Deviation (Population) | 2.7% | 2.6% |
Similar Demographics by Single Mother Households
Demographics Similar to Nigerians by Single Mother Households
In terms of single mother households, the demographic groups most similar to Nigerians are Guatemalan (7.7%, a difference of 0.030%), Immigrants from Sierra Leone (7.7%, a difference of 0.050%), Immigrants from Laos (7.7%, a difference of 0.050%), Immigrants from El Salvador (7.6%, a difference of 0.57%), and Immigrants from Belize (7.7%, a difference of 0.60%).
| Demographics | Rating | Rank | Single Mother Households |
| Guyanese | 0.1 /100 | #276 | Tragic 7.6% |
| Immigrants | Trinidad and Tobago | 0.1 /100 | #277 | Tragic 7.6% |
| Central Americans | 0.1 /100 | #278 | Tragic 7.6% |
| Immigrants | El Salvador | 0.0 /100 | #279 | Tragic 7.6% |
| Immigrants | Sierra Leone | 0.0 /100 | #280 | Tragic 7.7% |
| Immigrants | Laos | 0.0 /100 | #281 | Tragic 7.7% |
| Guatemalans | 0.0 /100 | #282 | Tragic 7.7% |
| Nigerians | 0.0 /100 | #283 | Tragic 7.7% |
| Immigrants | Belize | 0.0 /100 | #284 | Tragic 7.7% |
| Trinidadians and Tobagonians | 0.0 /100 | #285 | Tragic 7.7% |
| Immigrants | Middle Africa | 0.0 /100 | #286 | Tragic 7.7% |
| Immigrants | Guatemala | 0.0 /100 | #287 | Tragic 7.7% |
| Sierra Leoneans | 0.0 /100 | #288 | Tragic 7.7% |
| Sub-Saharan Africans | 0.0 /100 | #289 | Tragic 7.8% |
| Immigrants | Nigeria | 0.0 /100 | #290 | Tragic 7.8% |
Demographics Similar to Immigrants from Eastern Africa by Single Mother Households
In terms of single mother households, the demographic groups most similar to Immigrants from Eastern Africa are Immigrants (6.8%, a difference of 0.090%), Aleut (6.8%, a difference of 0.21%), Immigrants from Thailand (6.9%, a difference of 0.27%), Cherokee (6.8%, a difference of 0.36%), and French American Indian (6.9%, a difference of 0.47%).
| Demographics | Rating | Rank | Single Mother Households |
| Immigrants | Venezuela | 8.5 /100 | #211 | Tragic 6.7% |
| Immigrants | Eritrea | 8.4 /100 | #212 | Tragic 6.7% |
| Immigrants | Costa Rica | 8.2 /100 | #213 | Tragic 6.7% |
| Immigrants | Uruguay | 7.9 /100 | #214 | Tragic 6.7% |
| Shoshone | 5.7 /100 | #215 | Tragic 6.8% |
| Cherokee | 5.1 /100 | #216 | Tragic 6.8% |
| Aleuts | 4.8 /100 | #217 | Tragic 6.8% |
| Immigrants | Eastern Africa | 4.4 /100 | #218 | Tragic 6.8% |
| Immigrants | Immigrants | 4.3 /100 | #219 | Tragic 6.8% |
| Immigrants | Thailand | 4.0 /100 | #220 | Tragic 6.9% |
| French American Indians | 3.7 /100 | #221 | Tragic 6.9% |
| Immigrants | Bangladesh | 3.7 /100 | #222 | Tragic 6.9% |
| Immigrants | Micronesia | 3.6 /100 | #223 | Tragic 6.9% |
| Immigrants | Sudan | 3.5 /100 | #224 | Tragic 6.9% |
| Sudanese | 3.1 /100 | #225 | Tragic 6.9% |