Venezuelan vs Immigrants from Bulgaria Family Households
COMPARE
Venezuelan
Immigrants from Bulgaria
Family Households
Family Households Comparison
Venezuelans
Immigrants from Bulgaria
66.5%
FAMILY HOUSEHOLDS
100.0/ 100
METRIC RATING
45th/ 347
METRIC RANK
63.0%
FAMILY HOUSEHOLDS
0.2/ 100
METRIC RATING
280th/ 347
METRIC RANK
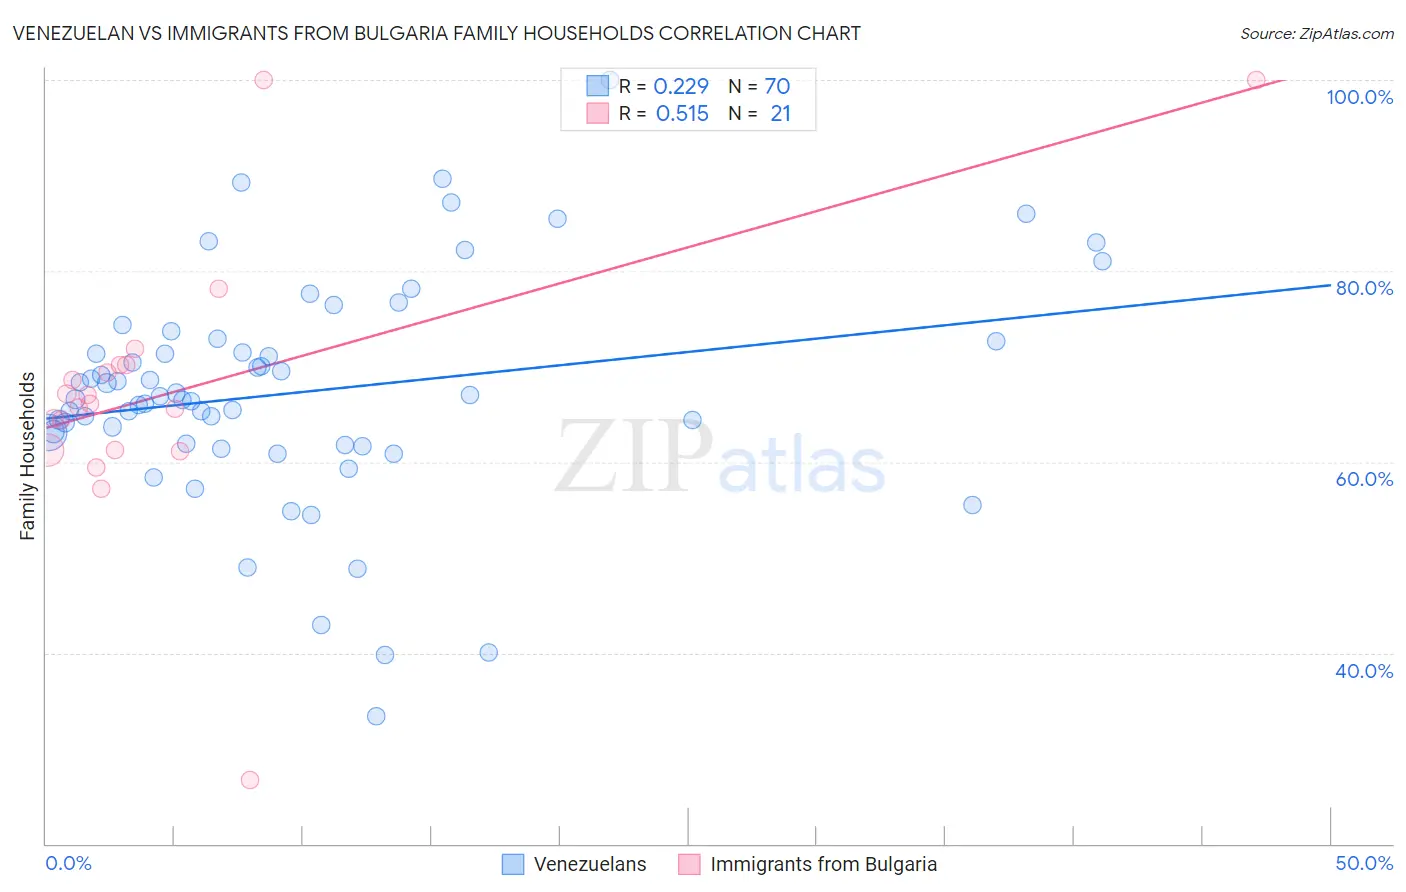
Venezuelan vs Immigrants from Bulgaria Family Households Correlation Chart
The statistical analysis conducted on geographies consisting of 306,138,924 people shows a weak positive correlation between the proportion of Venezuelans and percentage of family households in the United States with a correlation coefficient (R) of 0.229 and weighted average of 66.5%. Similarly, the statistical analysis conducted on geographies consisting of 172,541,029 people shows a substantial positive correlation between the proportion of Immigrants from Bulgaria and percentage of family households in the United States with a correlation coefficient (R) of 0.515 and weighted average of 63.0%, a difference of 5.6%.
Family Households Correlation Summary
| Measurement | Venezuelan | Immigrants from Bulgaria |
| Minimum | 33.3% | 26.6% |
| Maximum | 100.0% | 100.0% |
| Range | 66.7% | 73.4% |
| Mean | 67.3% | 67.4% |
| Median | 66.7% | 66.1% |
| Interquartile 25% (IQ1) | 61.9% | 61.2% |
| Interquartile 75% (IQ3) | 72.7% | 70.1% |
| Interquartile Range (IQR) | 10.7% | 8.9% |
| Standard Deviation (Sample) | 11.8% | 14.6% |
| Standard Deviation (Population) | 11.7% | 14.2% |
Similar Demographics by Family Households
Demographics Similar to Venezuelans by Family Households
In terms of family households, the demographic groups most similar to Venezuelans are Asian (66.5%, a difference of 0.020%), Arapaho (66.5%, a difference of 0.020%), Bolivian (66.5%, a difference of 0.050%), Apache (66.5%, a difference of 0.070%), and Immigrants from Venezuela (66.4%, a difference of 0.070%).
| Demographics | Rating | Rank | Family Households |
| Mexican American Indians | 100.0 /100 | #38 | Exceptional 67.0% |
| Immigrants | El Salvador | 100.0 /100 | #39 | Exceptional 67.0% |
| Guamanians/Chamorros | 100.0 /100 | #40 | Exceptional 66.6% |
| Immigrants | Bolivia | 100.0 /100 | #41 | Exceptional 66.6% |
| Menominee | 100.0 /100 | #42 | Exceptional 66.5% |
| Apache | 100.0 /100 | #43 | Exceptional 66.5% |
| Asians | 100.0 /100 | #44 | Exceptional 66.5% |
| Venezuelans | 100.0 /100 | #45 | Exceptional 66.5% |
| Arapaho | 100.0 /100 | #46 | Exceptional 66.5% |
| Bolivians | 100.0 /100 | #47 | Exceptional 66.5% |
| Immigrants | Venezuela | 100.0 /100 | #48 | Exceptional 66.4% |
| Immigrants | South Central Asia | 100.0 /100 | #49 | Exceptional 66.4% |
| Navajo | 100.0 /100 | #50 | Exceptional 66.4% |
| Natives/Alaskans | 100.0 /100 | #51 | Exceptional 66.4% |
| Colombians | 100.0 /100 | #52 | Exceptional 66.3% |
Demographics Similar to Immigrants from Bulgaria by Family Households
In terms of family households, the demographic groups most similar to Immigrants from Bulgaria are Immigrants from Yemen (63.0%, a difference of 0.010%), Immigrants from Belgium (63.0%, a difference of 0.050%), Ottawa (63.0%, a difference of 0.090%), Estonian (62.9%, a difference of 0.090%), and New Zealander (62.9%, a difference of 0.13%).
| Demographics | Rating | Rank | Family Households |
| Immigrants | Kazakhstan | 0.3 /100 | #273 | Tragic 63.1% |
| Lumbee | 0.3 /100 | #274 | Tragic 63.1% |
| West Indians | 0.3 /100 | #275 | Tragic 63.1% |
| Serbians | 0.3 /100 | #276 | Tragic 63.0% |
| Ottawa | 0.3 /100 | #277 | Tragic 63.0% |
| Immigrants | Belgium | 0.2 /100 | #278 | Tragic 63.0% |
| Immigrants | Yemen | 0.2 /100 | #279 | Tragic 63.0% |
| Immigrants | Bulgaria | 0.2 /100 | #280 | Tragic 63.0% |
| Estonians | 0.2 /100 | #281 | Tragic 62.9% |
| New Zealanders | 0.1 /100 | #282 | Tragic 62.9% |
| Immigrants | Denmark | 0.1 /100 | #283 | Tragic 62.9% |
| Australians | 0.1 /100 | #284 | Tragic 62.8% |
| Mongolians | 0.1 /100 | #285 | Tragic 62.8% |
| British West Indians | 0.1 /100 | #286 | Tragic 62.8% |
| Latvians | 0.1 /100 | #287 | Tragic 62.8% |