Shoshone vs Immigrants from Cuba Single Mother Households
COMPARE
Shoshone
Immigrants from Cuba
Single Mother Households
Single Mother Households Comparison
Shoshone
Immigrants from Cuba
6.8%
SINGLE MOTHER HOUSEHOLDS
5.7/ 100
METRIC RATING
215th/ 347
METRIC RANK
7.5%
SINGLE MOTHER HOUSEHOLDS
0.1/ 100
METRIC RATING
270th/ 347
METRIC RANK
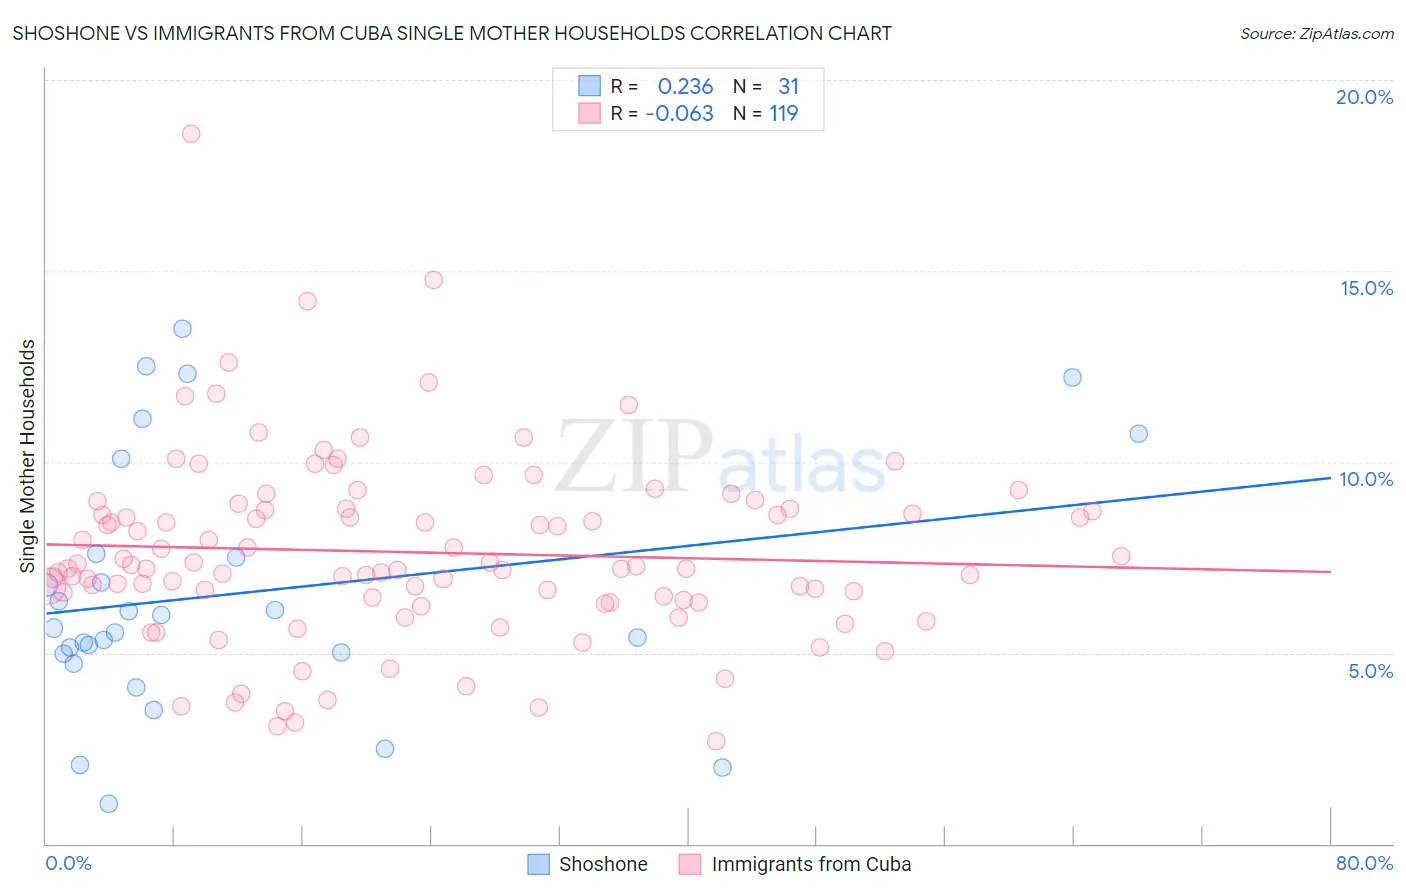
Shoshone vs Immigrants from Cuba Single Mother Households Correlation Chart
The statistical analysis conducted on geographies consisting of 66,546,675 people shows a weak positive correlation between the proportion of Shoshone and percentage of single mother households in the United States with a correlation coefficient (R) of 0.236 and weighted average of 6.8%. Similarly, the statistical analysis conducted on geographies consisting of 325,295,846 people shows a slight negative correlation between the proportion of Immigrants from Cuba and percentage of single mother households in the United States with a correlation coefficient (R) of -0.063 and weighted average of 7.5%, a difference of 10.8%.
Single Mother Households Correlation Summary
| Measurement | Shoshone | Immigrants from Cuba |
| Minimum | 1.1% | 2.7% |
| Maximum | 13.5% | 18.6% |
| Range | 12.4% | 15.9% |
| Mean | 6.6% | 7.6% |
| Median | 5.6% | 7.2% |
| Interquartile 25% (IQ1) | 5.0% | 6.4% |
| Interquartile 75% (IQ3) | 7.6% | 8.8% |
| Interquartile Range (IQR) | 2.6% | 2.4% |
| Standard Deviation (Sample) | 3.3% | 2.4% |
| Standard Deviation (Population) | 3.2% | 2.4% |
Similar Demographics by Single Mother Households
Demographics Similar to Shoshone by Single Mother Households
In terms of single mother households, the demographic groups most similar to Shoshone are Cherokee (6.8%, a difference of 0.29%), Aleut (6.8%, a difference of 0.44%), Immigrants from Eastern Africa (6.8%, a difference of 0.65%), Immigrants (6.8%, a difference of 0.74%), and Immigrants from Uruguay (6.7%, a difference of 0.91%).
| Demographics | Rating | Rank | Single Mother Households |
| Vietnamese | 11.3 /100 | #208 | Poor 6.7% |
| Immigrants | Colombia | 10.5 /100 | #209 | Poor 6.7% |
| Immigrants | Nonimmigrants | 10.4 /100 | #210 | Poor 6.7% |
| Immigrants | Venezuela | 8.5 /100 | #211 | Tragic 6.7% |
| Immigrants | Eritrea | 8.4 /100 | #212 | Tragic 6.7% |
| Immigrants | Costa Rica | 8.2 /100 | #213 | Tragic 6.7% |
| Immigrants | Uruguay | 7.9 /100 | #214 | Tragic 6.7% |
| Shoshone | 5.7 /100 | #215 | Tragic 6.8% |
| Cherokee | 5.1 /100 | #216 | Tragic 6.8% |
| Aleuts | 4.8 /100 | #217 | Tragic 6.8% |
| Immigrants | Eastern Africa | 4.4 /100 | #218 | Tragic 6.8% |
| Immigrants | Immigrants | 4.3 /100 | #219 | Tragic 6.8% |
| Immigrants | Thailand | 4.0 /100 | #220 | Tragic 6.9% |
| French American Indians | 3.7 /100 | #221 | Tragic 6.9% |
| Immigrants | Bangladesh | 3.7 /100 | #222 | Tragic 6.9% |
Demographics Similar to Immigrants from Cuba by Single Mother Households
In terms of single mother households, the demographic groups most similar to Immigrants from Cuba are Salvadoran (7.5%, a difference of 0.090%), Immigrants from the Azores (7.5%, a difference of 0.090%), Somali (7.5%, a difference of 0.16%), Belizean (7.6%, a difference of 0.40%), and Immigrants from Guyana (7.6%, a difference of 0.45%).
| Demographics | Rating | Rank | Single Mother Households |
| Immigrants | Nicaragua | 0.2 /100 | #263 | Tragic 7.4% |
| Yaqui | 0.1 /100 | #264 | Tragic 7.4% |
| Crow | 0.1 /100 | #265 | Tragic 7.4% |
| Nepalese | 0.1 /100 | #266 | Tragic 7.5% |
| Blackfeet | 0.1 /100 | #267 | Tragic 7.5% |
| Indonesians | 0.1 /100 | #268 | Tragic 7.5% |
| Somalis | 0.1 /100 | #269 | Tragic 7.5% |
| Immigrants | Cuba | 0.1 /100 | #270 | Tragic 7.5% |
| Salvadorans | 0.1 /100 | #271 | Tragic 7.5% |
| Immigrants | Azores | 0.1 /100 | #272 | Tragic 7.5% |
| Belizeans | 0.1 /100 | #273 | Tragic 7.6% |
| Immigrants | Guyana | 0.1 /100 | #274 | Tragic 7.6% |
| Central American Indians | 0.1 /100 | #275 | Tragic 7.6% |
| Guyanese | 0.1 /100 | #276 | Tragic 7.6% |
| Immigrants | Trinidad and Tobago | 0.1 /100 | #277 | Tragic 7.6% |