Shoshone vs Houma Single Mother Households
COMPARE
Shoshone
Houma
Single Mother Households
Single Mother Households Comparison
Shoshone
Houma
6.8%
SINGLE MOTHER HOUSEHOLDS
5.7/ 100
METRIC RATING
215th/ 347
METRIC RANK
7.9%
SINGLE MOTHER HOUSEHOLDS
0.0/ 100
METRIC RATING
299th/ 347
METRIC RANK
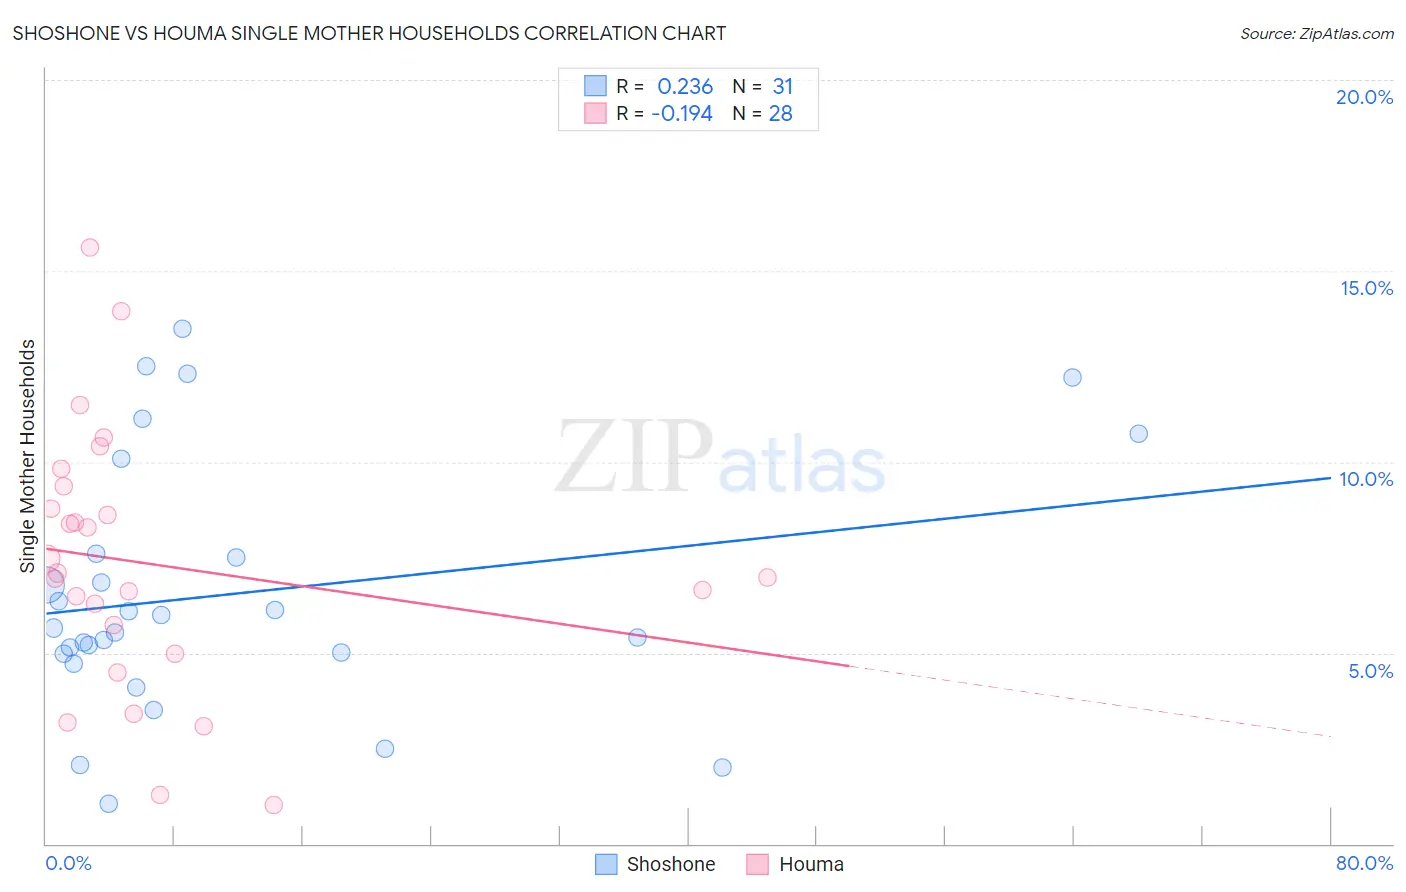
Shoshone vs Houma Single Mother Households Correlation Chart
The statistical analysis conducted on geographies consisting of 66,546,675 people shows a weak positive correlation between the proportion of Shoshone and percentage of single mother households in the United States with a correlation coefficient (R) of 0.236 and weighted average of 6.8%. Similarly, the statistical analysis conducted on geographies consisting of 36,776,416 people shows a poor negative correlation between the proportion of Houma and percentage of single mother households in the United States with a correlation coefficient (R) of -0.194 and weighted average of 7.9%, a difference of 16.7%.
Single Mother Households Correlation Summary
| Measurement | Shoshone | Houma |
| Minimum | 1.1% | 1.0% |
| Maximum | 13.5% | 15.6% |
| Range | 12.4% | 14.6% |
| Mean | 6.6% | 7.3% |
| Median | 5.6% | 7.0% |
| Interquartile 25% (IQ1) | 5.0% | 5.4% |
| Interquartile 75% (IQ3) | 7.6% | 9.1% |
| Interquartile Range (IQR) | 2.6% | 3.7% |
| Standard Deviation (Sample) | 3.3% | 3.4% |
| Standard Deviation (Population) | 3.2% | 3.3% |
Similar Demographics by Single Mother Households
Demographics Similar to Shoshone by Single Mother Households
In terms of single mother households, the demographic groups most similar to Shoshone are Cherokee (6.8%, a difference of 0.29%), Aleut (6.8%, a difference of 0.44%), Immigrants from Eastern Africa (6.8%, a difference of 0.65%), Immigrants (6.8%, a difference of 0.74%), and Immigrants from Uruguay (6.7%, a difference of 0.91%).
| Demographics | Rating | Rank | Single Mother Households |
| Vietnamese | 11.3 /100 | #208 | Poor 6.7% |
| Immigrants | Colombia | 10.5 /100 | #209 | Poor 6.7% |
| Immigrants | Nonimmigrants | 10.4 /100 | #210 | Poor 6.7% |
| Immigrants | Venezuela | 8.5 /100 | #211 | Tragic 6.7% |
| Immigrants | Eritrea | 8.4 /100 | #212 | Tragic 6.7% |
| Immigrants | Costa Rica | 8.2 /100 | #213 | Tragic 6.7% |
| Immigrants | Uruguay | 7.9 /100 | #214 | Tragic 6.7% |
| Shoshone | 5.7 /100 | #215 | Tragic 6.8% |
| Cherokee | 5.1 /100 | #216 | Tragic 6.8% |
| Aleuts | 4.8 /100 | #217 | Tragic 6.8% |
| Immigrants | Eastern Africa | 4.4 /100 | #218 | Tragic 6.8% |
| Immigrants | Immigrants | 4.3 /100 | #219 | Tragic 6.8% |
| Immigrants | Thailand | 4.0 /100 | #220 | Tragic 6.9% |
| French American Indians | 3.7 /100 | #221 | Tragic 6.9% |
| Immigrants | Bangladesh | 3.7 /100 | #222 | Tragic 6.9% |
Demographics Similar to Houma by Single Mother Households
In terms of single mother households, the demographic groups most similar to Houma are Immigrants from West Indies (7.9%, a difference of 0.080%), Hispanic or Latino (7.9%, a difference of 0.19%), Immigrants from Latin America (7.9%, a difference of 0.23%), Barbadian (7.9%, a difference of 0.30%), and Mexican (8.0%, a difference of 0.46%).
| Demographics | Rating | Rank | Single Mother Households |
| Ghanaians | 0.0 /100 | #292 | Tragic 7.8% |
| Immigrants | Cameroon | 0.0 /100 | #293 | Tragic 7.9% |
| Apache | 0.0 /100 | #294 | Tragic 7.9% |
| Barbadians | 0.0 /100 | #295 | Tragic 7.9% |
| Immigrants | Latin America | 0.0 /100 | #296 | Tragic 7.9% |
| Hispanics or Latinos | 0.0 /100 | #297 | Tragic 7.9% |
| Immigrants | West Indies | 0.0 /100 | #298 | Tragic 7.9% |
| Houma | 0.0 /100 | #299 | Tragic 7.9% |
| Mexicans | 0.0 /100 | #300 | Tragic 8.0% |
| Chippewa | 0.0 /100 | #301 | Tragic 8.0% |
| Immigrants | Ghana | 0.0 /100 | #302 | Tragic 8.0% |
| Immigrants | Bahamas | 0.0 /100 | #303 | Tragic 8.0% |
| Natives/Alaskans | 0.0 /100 | #304 | Tragic 8.0% |
| Colville | 0.0 /100 | #305 | Tragic 8.0% |
| Immigrants | Barbados | 0.0 /100 | #306 | Tragic 8.0% |