Somali vs Immigrants from Cuba Single Mother Households
COMPARE
Somali
Immigrants from Cuba
Single Mother Households
Single Mother Households Comparison
Somalis
Immigrants from Cuba
7.5%
SINGLE MOTHER HOUSEHOLDS
0.1/ 100
METRIC RATING
269th/ 347
METRIC RANK
7.5%
SINGLE MOTHER HOUSEHOLDS
0.1/ 100
METRIC RATING
270th/ 347
METRIC RANK
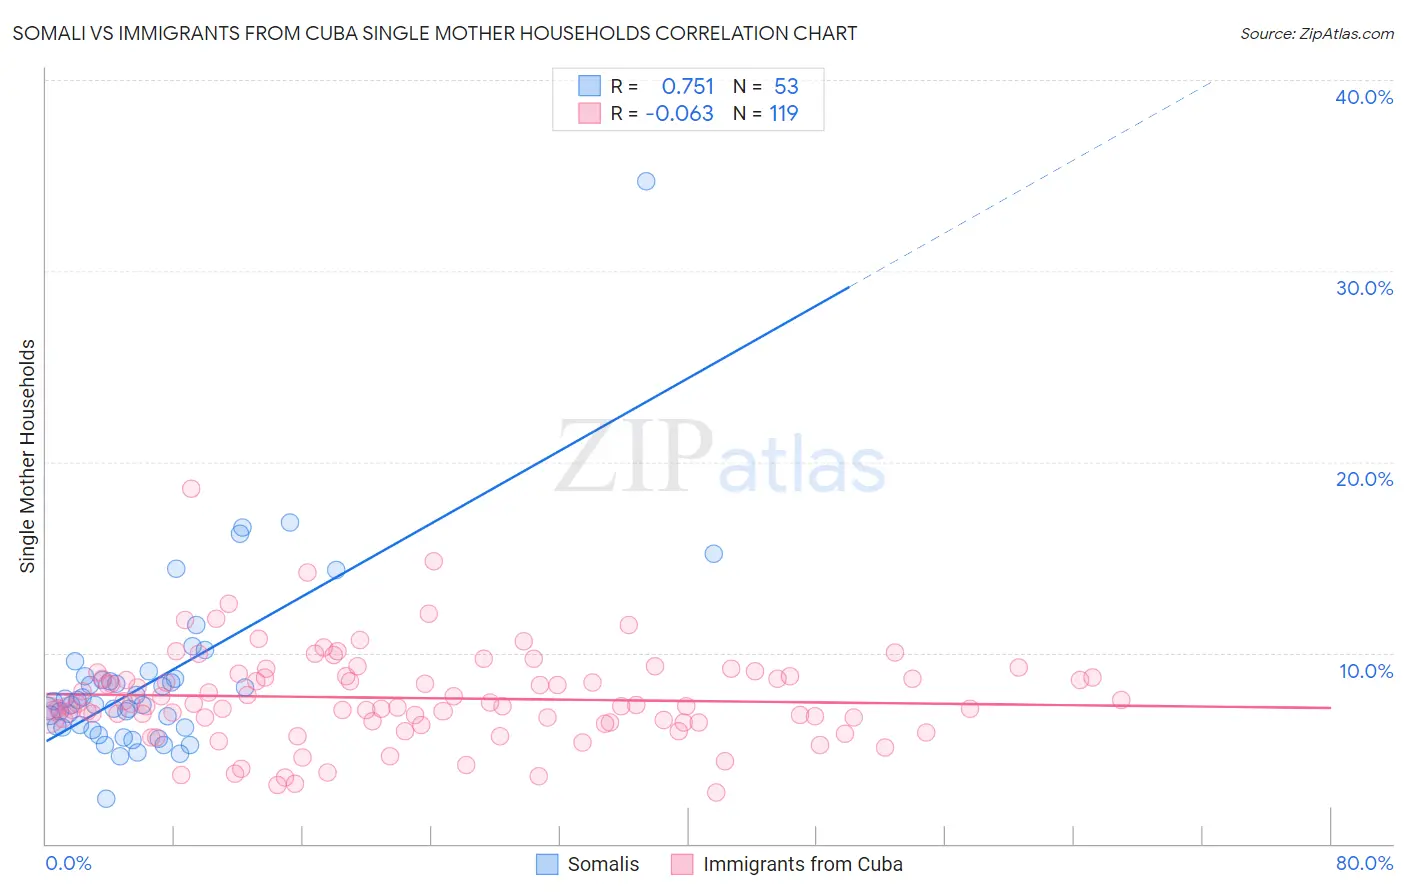
Somali vs Immigrants from Cuba Single Mother Households Correlation Chart
The statistical analysis conducted on geographies consisting of 99,265,723 people shows a strong positive correlation between the proportion of Somalis and percentage of single mother households in the United States with a correlation coefficient (R) of 0.751 and weighted average of 7.5%. Similarly, the statistical analysis conducted on geographies consisting of 325,295,846 people shows a slight negative correlation between the proportion of Immigrants from Cuba and percentage of single mother households in the United States with a correlation coefficient (R) of -0.063 and weighted average of 7.5%, a difference of 0.16%.
Single Mother Households Correlation Summary
| Measurement | Somali | Immigrants from Cuba |
| Minimum | 2.4% | 2.7% |
| Maximum | 34.7% | 18.6% |
| Range | 32.3% | 15.9% |
| Mean | 8.6% | 7.6% |
| Median | 7.3% | 7.2% |
| Interquartile 25% (IQ1) | 6.1% | 6.4% |
| Interquartile 75% (IQ3) | 8.7% | 8.8% |
| Interquartile Range (IQR) | 2.6% | 2.4% |
| Standard Deviation (Sample) | 4.8% | 2.4% |
| Standard Deviation (Population) | 4.8% | 2.4% |
Demographics Similar to Somalis and Immigrants from Cuba by Single Mother Households
In terms of single mother households, the demographic groups most similar to Somalis are Salvadoran (7.5%, a difference of 0.25%), Immigrants from the Azores (7.5%, a difference of 0.25%), Indonesian (7.5%, a difference of 0.41%), Blackfeet (7.5%, a difference of 0.45%), and Belizean (7.6%, a difference of 0.57%). Similarly, the demographic groups most similar to Immigrants from Cuba are Salvadoran (7.5%, a difference of 0.090%), Immigrants from the Azores (7.5%, a difference of 0.090%), Belizean (7.6%, a difference of 0.40%), Immigrants from Guyana (7.6%, a difference of 0.45%), and Central American Indian (7.6%, a difference of 0.55%).
| Demographics | Rating | Rank | Single Mother Households |
| Immigrants | Yemen | 0.2 /100 | #259 | Tragic 7.4% |
| Immigrants | Zaire | 0.2 /100 | #260 | Tragic 7.4% |
| Japanese | 0.2 /100 | #261 | Tragic 7.4% |
| Immigrants | Somalia | 0.2 /100 | #262 | Tragic 7.4% |
| Immigrants | Nicaragua | 0.2 /100 | #263 | Tragic 7.4% |
| Yaqui | 0.1 /100 | #264 | Tragic 7.4% |
| Crow | 0.1 /100 | #265 | Tragic 7.4% |
| Nepalese | 0.1 /100 | #266 | Tragic 7.5% |
| Blackfeet | 0.1 /100 | #267 | Tragic 7.5% |
| Indonesians | 0.1 /100 | #268 | Tragic 7.5% |
| Somalis | 0.1 /100 | #269 | Tragic 7.5% |
| Immigrants | Cuba | 0.1 /100 | #270 | Tragic 7.5% |
| Salvadorans | 0.1 /100 | #271 | Tragic 7.5% |
| Immigrants | Azores | 0.1 /100 | #272 | Tragic 7.5% |
| Belizeans | 0.1 /100 | #273 | Tragic 7.6% |
| Immigrants | Guyana | 0.1 /100 | #274 | Tragic 7.6% |
| Central American Indians | 0.1 /100 | #275 | Tragic 7.6% |
| Guyanese | 0.1 /100 | #276 | Tragic 7.6% |
| Immigrants | Trinidad and Tobago | 0.1 /100 | #277 | Tragic 7.6% |
| Central Americans | 0.1 /100 | #278 | Tragic 7.6% |
| Immigrants | El Salvador | 0.0 /100 | #279 | Tragic 7.6% |