Shoshone vs Immigrants from Cuba 6th Grade

COMPARE

Shoshone
Race
Ancestry
AfghanAfricanAlaska NativeAlaskan AthabascanAlbanianAleutAlsatianAmericanApacheArabArapahoArgentineanArmenianAssyrian/Chaldean/SyriacAustralianAustrianBahamianBangladeshiBarbadianBasqueBelgianBelizeanBermudanBhutaneseBlackfeetBolivianBrazilianBritishBritish West IndianBulgarianBurmeseCajunCambodianCanadianCape VerdeanCarpatho RusynCelticCentral AmericanCentral American IndianCherokeeCheyenneChickasawChileanChineseChippewaChoctawColombianColvilleComancheCosta RicanCreeCreekCroatianCrowCubanCypriotCzechCzechoslovakianDanishDelawareDominicanDutchDutch West IndianEastern EuropeanEcuadorianEgyptianEnglishEstonianEthiopianEuropeanFijianFilipinoFinnishFrenchFrench American IndianFrench CanadianGermanGerman RussianGhanaianGreekGuamanian/ChamorroGuatemalanGuyaneseHaitianHmongHonduranHopiHoumaHungarianIcelanderIndian (Asian)IndonesianInupiatIranianIraqiIrishIroquoisIsraeliItalianJamaicanJapaneseJordanianKenyanKiowaKoreanLaotianLatvianLebaneseLiberianLithuanianLumbeeLuxembourgerMacedonianMalaysianMalteseMarshalleseMenomineeMexicanMexican American IndianMongolianMoroccanNative HawaiianNavajoNepaleseNew ZealanderNicaraguanNigerianNorthern EuropeanNorwegianOkinawanOsageOttawaPaiutePakistaniPalestinianPanamanianParaguayanPennsylvania GermanPeruvianPimaPolishPortuguesePotawatomiPuebloPuerto RicanPuget Sound SalishRomanianRussianSalvadoranSamoanScandinavianScotch-IrishScottishSeminoleSenegaleseSerbianShoshoneSierra LeoneanSiouxSlavicSlovakSloveneSomaliSouth AfricanSouth AmericanSouth American IndianSoviet UnionSpaniardSpanishSpanish AmericanSpanish American IndianSri LankanSubsaharan AfricanSudaneseSwedishSwissSyrianTaiwaneseThaiTlingit-HaidaTohono O'OdhamTonganTrinidadian and TobagonianTsimshianTurkishU.S. Virgin IslanderUgandanUkrainianUruguayanUteVenezuelanVietnameseWelshWest IndianYakamaYaquiYugoslavianYumanYup'ikZimbabwean
Immigration
NonimmigrantsImmigrantsAfghanistanAfricaAlbaniaArgentinaArmeniaAsiaAustraliaAustriaBahamasBangladeshBarbadosBelarusBelgiumBelizeBoliviaBosnia and HerzegovinaBrazilBulgariaBurma/MyanmarCabo VerdeCambodiaCameroonCanadaCaribbeanCentral AmericaChileChinaColombiaCongoCosta RicaCroatiaCzechoslovakiaDenmarkDominicaDominican RepublicEastern AfricaEastern AsiaEastern EuropeEcuadorEgyptEl SalvadorEnglandEritreaEthiopiaEuropeFijiFranceGermanyGhanaGreeceGrenadaGuatemalaGuyanaHaitiHondurasHong KongHungaryIndiaIndonesiaIranIraqIrelandIsraelItalyJamaicaJapanJordanKazakhstanKenyaKoreaKuwaitLaosLatin AmericaLatviaLebanonLiberiaLithuaniaMalaysiaMexicoMicronesiaMiddle AfricaMoldovaMoroccoNepalNetherlandsNicaraguaNigeriaNorth AmericaNorth MacedoniaNorthern AfricaNorthern EuropeNorwayOceaniaPakistanPanamaPeruPhilippinesPolandPortugalRomaniaRussiaSaudi ArabiaScotlandSenegalSerbiaSierra LeoneSingaporeSomaliaSouth AfricaSouth AmericaSouth Central AsiaSouth Eastern AsiaSouthern EuropeSpainSri LankaSt. Vincent and the GrenadinesSudanSwedenSwitzerlandSyriaTaiwanThailandTrinidad and TobagoTurkeyUgandaUkraineUruguayUzbekistanVenezuelaVietnamWest IndiesWestern AfricaWestern AsiaWestern EuropeYemenZaireZimbabweAzores
Immigrants from Cuba
Race
Ancestry
AfghanAfricanAlaska NativeAlaskan AthabascanAlbanianAleutAlsatianAmericanApacheArabArapahoArgentineanArmenianAssyrian/Chaldean/SyriacAustralianAustrianBahamianBangladeshiBarbadianBasqueBelgianBelizeanBermudanBhutaneseBlackfeetBolivianBrazilianBritishBritish West IndianBulgarianBurmeseCajunCambodianCanadianCape VerdeanCarpatho RusynCelticCentral AmericanCentral American IndianCherokeeCheyenneChickasawChileanChineseChippewaChoctawColombianColvilleComancheCosta RicanCreeCreekCroatianCrowCubanCypriotCzechCzechoslovakianDanishDelawareDominicanDutchDutch West IndianEastern EuropeanEcuadorianEgyptianEnglishEstonianEthiopianEuropeanFijianFilipinoFinnishFrenchFrench American IndianFrench CanadianGermanGerman RussianGhanaianGreekGuamanian/ChamorroGuatemalanGuyaneseHaitianHmongHonduranHopiHoumaHungarianIcelanderIndian (Asian)IndonesianInupiatIranianIraqiIrishIroquoisIsraeliItalianJamaicanJapaneseJordanianKenyanKiowaKoreanLaotianLatvianLebaneseLiberianLithuanianLumbeeLuxembourgerMacedonianMalaysianMalteseMarshalleseMenomineeMexicanMexican American IndianMongolianMoroccanNative HawaiianNavajoNepaleseNew ZealanderNicaraguanNigerianNorthern EuropeanNorwegianOkinawanOsageOttawaPaiutePakistaniPalestinianPanamanianParaguayanPennsylvania GermanPeruvianPimaPolishPortuguesePotawatomiPuebloPuerto RicanPuget Sound SalishRomanianRussianSalvadoranSamoanScandinavianScotch-IrishScottishSeminoleSenegaleseSerbianSierra LeoneanSiouxSlavicSlovakSloveneSomaliSouth AfricanSouth AmericanSouth American IndianSoviet UnionSpaniardSpanishSpanish AmericanSpanish American IndianSri LankanSubsaharan AfricanSudaneseSwedishSwissSyrianTaiwaneseThaiTlingit-HaidaTohono O'OdhamTonganTrinidadian and TobagonianTsimshianTurkishU.S. Virgin IslanderUgandanUkrainianUruguayanUteVenezuelanVietnameseWelshWest IndianYakamaYaquiYugoslavianYumanYup'ikZimbabwean
Immigration
NonimmigrantsImmigrantsAfghanistanAfricaAlbaniaArgentinaArmeniaAsiaAustraliaAustriaBahamasBangladeshBarbadosBelarusBelgiumBelizeBoliviaBosnia and HerzegovinaBrazilBulgariaBurma/MyanmarCabo VerdeCambodiaCameroonCanadaCaribbeanCentral AmericaChileChinaColombiaCongoCosta RicaCroatiaCubaCzechoslovakiaDenmarkDominicaDominican RepublicEastern AfricaEastern AsiaEastern EuropeEcuadorEgyptEl SalvadorEnglandEritreaEthiopiaEuropeFijiFranceGermanyGhanaGreeceGrenadaGuatemalaGuyanaHaitiHondurasHong KongHungaryIndiaIndonesiaIranIraqIrelandIsraelItalyJamaicaJapanJordanKazakhstanKenyaKoreaKuwaitLaosLatin AmericaLatviaLebanonLiberiaLithuaniaMalaysiaMexicoMicronesiaMiddle AfricaMoldovaMoroccoNepalNetherlandsNicaraguaNigeriaNorth AmericaNorth MacedoniaNorthern AfricaNorthern EuropeNorwayOceaniaPakistanPanamaPeruPhilippinesPolandPortugalRomaniaRussiaSaudi ArabiaScotlandSenegalSerbiaSierra LeoneSingaporeSomaliaSouth AfricaSouth AmericaSouth Central AsiaSouth Eastern AsiaSouthern EuropeSpainSri LankaSt. Vincent and the GrenadinesSudanSwedenSwitzerlandSyriaTaiwanThailandTrinidad and TobagoTurkeyUgandaUkraineUruguayUzbekistanVenezuelaVietnamWest IndiesWestern AfricaWestern AsiaWestern EuropeYemenZaireZimbabweAzores
6th Grade
Income
Poverty
Unemployment
Labor Participation
Family Structure
Vehicle Availability
Education Level
Disability

6th Grade Comparison

Shoshone

Immigrants from Cuba

Exceptional
Tragic
97.6%
6TH GRADE
99.0/ 100
METRIC RATING
84th/ 347
METRIC RANK
95.6%
6TH GRADE
0.0/ 100
METRIC RATING
305th/ 347
METRIC RANK

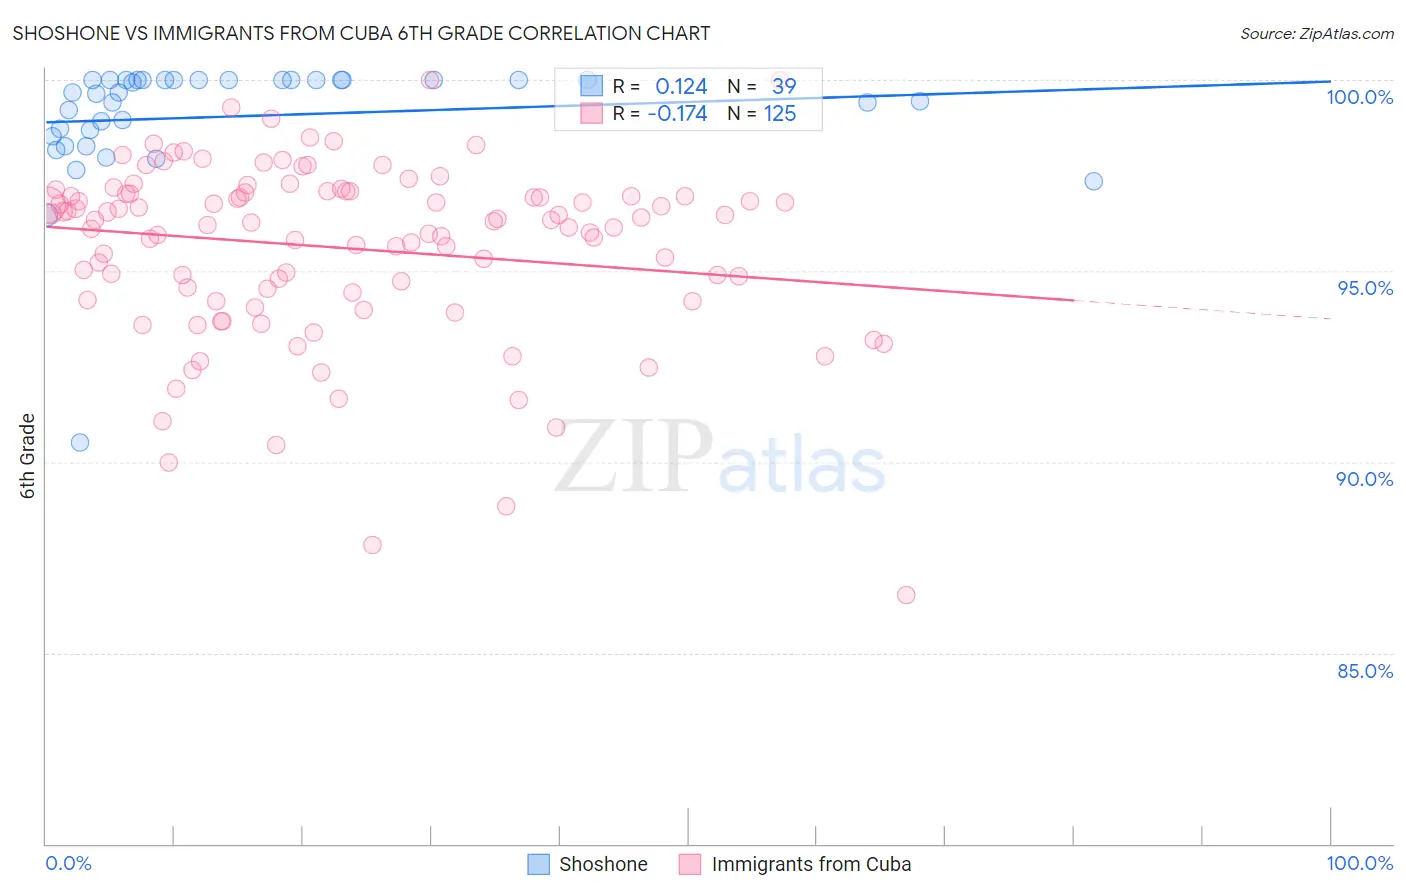
Shoshone vs Immigrants from Cuba 6th Grade Correlation Chart

The statistical analysis conducted on geographies consisting of 66,625,086 people shows a poor positive correlation between the proportion of Shoshone and percentage of population with at least 6th grade education in the United States with a correlation coefficient (R) of 0.124 and weighted average of 97.6%. Similarly, the statistical analysis conducted on geographies consisting of 326,028,159 people shows a poor negative correlation between the proportion of Immigrants from Cuba and percentage of population with at least 6th grade education in the United States with a correlation coefficient (R) of -0.174 and weighted average of 95.6%, a difference of 2.0%.
Shoshone vs Immigrants from Cuba 6th Grade

6th Grade Correlation Summary

MeasurementShoshoneImmigrants from Cuba
Minimum90.5%86.5%
Maximum100.0%100.0%
Range9.5%13.5%
Mean99.0%95.6%
Median99.7%96.3%
Interquartile 25% (IQ1)98.5%94.3%
Interquartile 75% (IQ3)100.0%97.0%
Interquartile Range (IQR)1.5%2.7%
Standard Deviation (Sample)1.7%2.3%
Standard Deviation (Population)1.7%2.3%

Similar Demographics by 6th Grade

Demographics Similar to Shoshone by 6th Grade

In terms of 6th grade, the demographic groups most similar to Shoshone are Zimbabwean (97.6%, a difference of 0.010%), Potawatomi (97.6%, a difference of 0.010%), Delaware (97.6%, a difference of 0.010%), Lumbee (97.6%, a difference of 0.020%), and Immigrants from Belgium (97.5%, a difference of 0.020%).
DemographicsRating | Rank6th Grade
Immigrants | Lithuania
99.3
/100
|
#77
Exceptional
97.6%
Icelanders
99.3
/100
|
#78
Exceptional
97.6%
Immigrants | India
99.3
/100
|
#79
Exceptional
97.6%
Osage
99.3
/100
|
#80
Exceptional
97.6%
Lumbee
99.2
/100
|
#81
Exceptional
97.6%
Zimbabweans
99.1
/100
|
#82
Exceptional
97.6%
Potawatomi
99.1
/100
|
#83
Exceptional
97.6%
Shoshone
99.0
/100
|
#84
Exceptional
97.6%
Delaware
98.9
/100
|
#85
Exceptional
97.6%
Immigrants | Belgium
98.9
/100
|
#86
Exceptional
97.5%
Puget Sound Salish
98.9
/100
|
#87
Exceptional
97.5%
Immigrants | South Africa
98.9
/100
|
#88
Exceptional
97.5%
Immigrants | Australia
98.8
/100
|
#89
Exceptional
97.5%
Pueblo
98.8
/100
|
#90
Exceptional
97.5%
Immigrants | Western Europe
98.8
/100
|
#91
Exceptional
97.5%

Demographics Similar to Immigrants from Cuba by 6th Grade

In terms of 6th grade, the demographic groups most similar to Immigrants from Cuba are Indonesian (95.6%, a difference of 0.020%), Bangladeshi (95.7%, a difference of 0.030%), Immigrants from Haiti (95.6%, a difference of 0.040%), Guyanese (95.6%, a difference of 0.060%), and Immigrants from Caribbean (95.6%, a difference of 0.070%).
DemographicsRating | Rank6th Grade
Sri Lankans
0.0
/100
|
#298
Tragic
95.8%
Immigrants | Laos
0.0
/100
|
#299
Tragic
95.7%
Immigrants | Dominica
0.0
/100
|
#300
Tragic
95.7%
Immigrants | Immigrants
0.0
/100
|
#301
Tragic
95.7%
Immigrants | Burma/Myanmar
0.0
/100
|
#302
Tragic
95.7%
Bangladeshis
0.0
/100
|
#303
Tragic
95.7%
Indonesians
0.0
/100
|
#304
Tragic
95.6%
Immigrants | Cuba
0.0
/100
|
#305
Tragic
95.6%
Immigrants | Haiti
0.0
/100
|
#306
Tragic
95.6%
Guyanese
0.0
/100
|
#307
Tragic
95.6%
Immigrants | Caribbean
0.0
/100
|
#308
Tragic
95.6%
Puerto Ricans
0.0
/100
|
#309
Tragic
95.5%
Ecuadorians
0.0
/100
|
#310
Tragic
95.5%
Immigrants | Portugal
0.0
/100
|
#311
Tragic
95.5%
Immigrants | Guyana
0.0
/100
|
#312
Tragic
95.5%