Immigrants from Austria vs Immigrants from Cuba Single Mother Households
COMPARE
Immigrants from Austria
Immigrants from Cuba
Single Mother Households
Single Mother Households Comparison
Immigrants from Austria
Immigrants from Cuba
5.2%
SINGLE MOTHER HOUSEHOLDS
99.8/ 100
METRIC RATING
23rd/ 347
METRIC RANK
7.5%
SINGLE MOTHER HOUSEHOLDS
0.1/ 100
METRIC RATING
270th/ 347
METRIC RANK
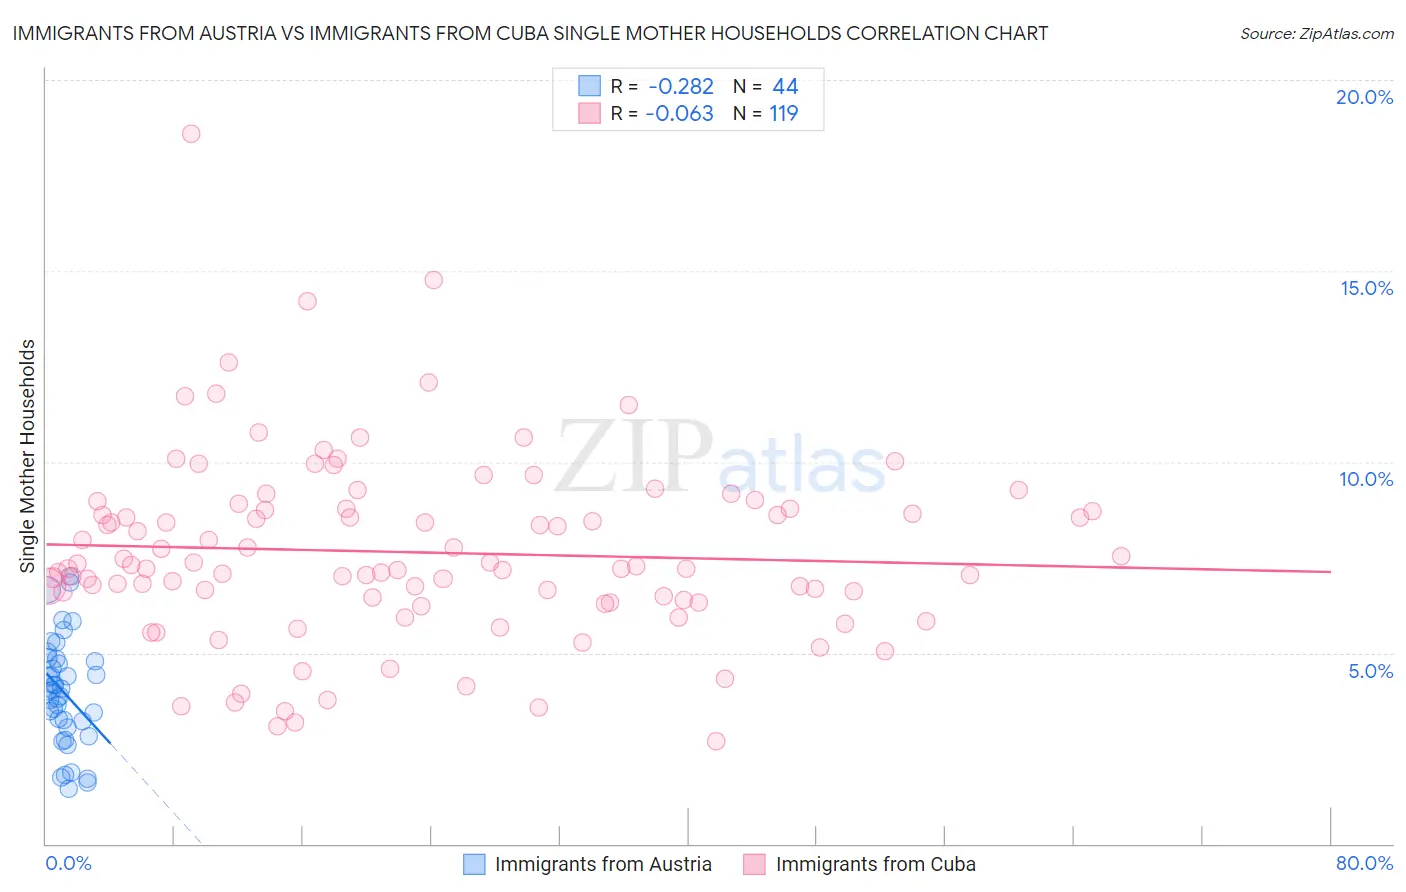
Immigrants from Austria vs Immigrants from Cuba Single Mother Households Correlation Chart
The statistical analysis conducted on geographies consisting of 167,548,471 people shows a weak negative correlation between the proportion of Immigrants from Austria and percentage of single mother households in the United States with a correlation coefficient (R) of -0.282 and weighted average of 5.2%. Similarly, the statistical analysis conducted on geographies consisting of 325,295,846 people shows a slight negative correlation between the proportion of Immigrants from Cuba and percentage of single mother households in the United States with a correlation coefficient (R) of -0.063 and weighted average of 7.5%, a difference of 43.9%.
Single Mother Households Correlation Summary
| Measurement | Immigrants from Austria | Immigrants from Cuba |
| Minimum | 1.5% | 2.7% |
| Maximum | 7.0% | 18.6% |
| Range | 5.6% | 15.9% |
| Mean | 4.0% | 7.6% |
| Median | 4.0% | 7.2% |
| Interquartile 25% (IQ1) | 3.1% | 6.4% |
| Interquartile 75% (IQ3) | 4.8% | 8.8% |
| Interquartile Range (IQR) | 1.7% | 2.4% |
| Standard Deviation (Sample) | 1.4% | 2.4% |
| Standard Deviation (Population) | 1.4% | 2.4% |
Similar Demographics by Single Mother Households
Demographics Similar to Immigrants from Austria by Single Mother Households
In terms of single mother households, the demographic groups most similar to Immigrants from Austria are Thai (5.2%, a difference of 0.050%), Armenian (5.2%, a difference of 0.060%), Immigrants from Japan (5.2%, a difference of 0.39%), Immigrants from Lithuania (5.3%, a difference of 0.42%), and Eastern European (5.2%, a difference of 0.77%).
| Demographics | Rating | Rank | Single Mother Households |
| Indians (Asian) | 99.9 /100 | #16 | Exceptional 5.1% |
| Soviet Union | 99.9 /100 | #17 | Exceptional 5.1% |
| Immigrants | Armenia | 99.9 /100 | #18 | Exceptional 5.2% |
| Chinese | 99.9 /100 | #19 | Exceptional 5.2% |
| Maltese | 99.9 /100 | #20 | Exceptional 5.2% |
| Eastern Europeans | 99.8 /100 | #21 | Exceptional 5.2% |
| Thais | 99.8 /100 | #22 | Exceptional 5.2% |
| Immigrants | Austria | 99.8 /100 | #23 | Exceptional 5.2% |
| Armenians | 99.8 /100 | #24 | Exceptional 5.2% |
| Immigrants | Japan | 99.8 /100 | #25 | Exceptional 5.2% |
| Immigrants | Lithuania | 99.8 /100 | #26 | Exceptional 5.3% |
| Bhutanese | 99.7 /100 | #27 | Exceptional 5.3% |
| Russians | 99.7 /100 | #28 | Exceptional 5.3% |
| Latvians | 99.7 /100 | #29 | Exceptional 5.3% |
| Burmese | 99.7 /100 | #30 | Exceptional 5.3% |
Demographics Similar to Immigrants from Cuba by Single Mother Households
In terms of single mother households, the demographic groups most similar to Immigrants from Cuba are Salvadoran (7.5%, a difference of 0.090%), Immigrants from the Azores (7.5%, a difference of 0.090%), Somali (7.5%, a difference of 0.16%), Belizean (7.6%, a difference of 0.40%), and Immigrants from Guyana (7.6%, a difference of 0.45%).
| Demographics | Rating | Rank | Single Mother Households |
| Immigrants | Nicaragua | 0.2 /100 | #263 | Tragic 7.4% |
| Yaqui | 0.1 /100 | #264 | Tragic 7.4% |
| Crow | 0.1 /100 | #265 | Tragic 7.4% |
| Nepalese | 0.1 /100 | #266 | Tragic 7.5% |
| Blackfeet | 0.1 /100 | #267 | Tragic 7.5% |
| Indonesians | 0.1 /100 | #268 | Tragic 7.5% |
| Somalis | 0.1 /100 | #269 | Tragic 7.5% |
| Immigrants | Cuba | 0.1 /100 | #270 | Tragic 7.5% |
| Salvadorans | 0.1 /100 | #271 | Tragic 7.5% |
| Immigrants | Azores | 0.1 /100 | #272 | Tragic 7.5% |
| Belizeans | 0.1 /100 | #273 | Tragic 7.6% |
| Immigrants | Guyana | 0.1 /100 | #274 | Tragic 7.6% |
| Central American Indians | 0.1 /100 | #275 | Tragic 7.6% |
| Guyanese | 0.1 /100 | #276 | Tragic 7.6% |
| Immigrants | Trinidad and Tobago | 0.1 /100 | #277 | Tragic 7.6% |