Shoshone vs Immigrants from West Indies Family Households
COMPARE
Shoshone
Immigrants from West Indies
Family Households
Family Households Comparison
Shoshone
Immigrants from West Indies
63.8%
FAMILY HOUSEHOLDS
9.4/ 100
METRIC RATING
211th/ 347
METRIC RANK
61.6%
FAMILY HOUSEHOLDS
0.0/ 100
METRIC RATING
324th/ 347
METRIC RANK
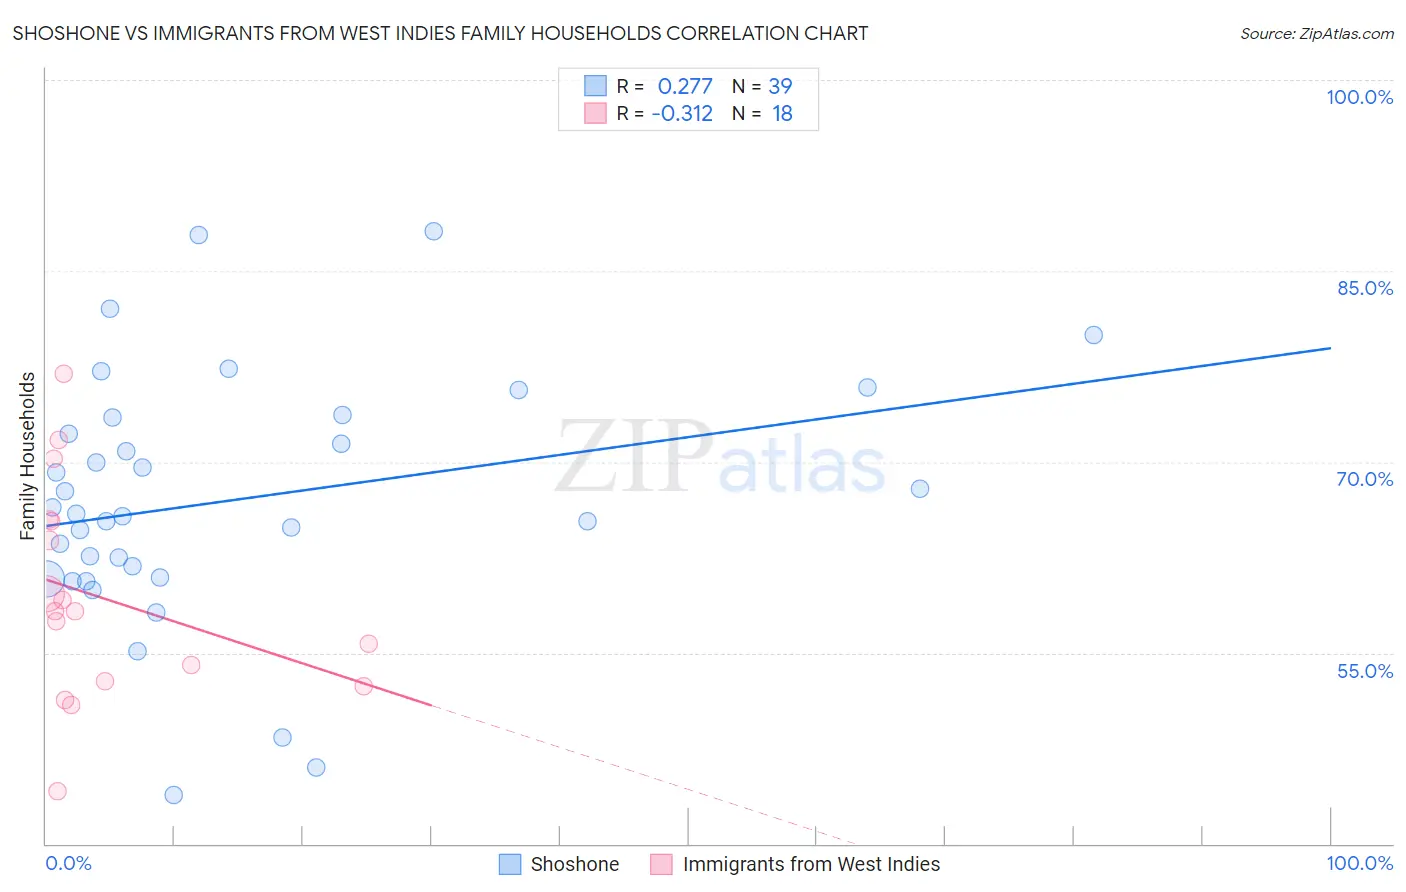
Shoshone vs Immigrants from West Indies Family Households Correlation Chart
The statistical analysis conducted on geographies consisting of 66,615,877 people shows a weak positive correlation between the proportion of Shoshone and percentage of family households in the United States with a correlation coefficient (R) of 0.277 and weighted average of 63.8%. Similarly, the statistical analysis conducted on geographies consisting of 72,452,456 people shows a mild negative correlation between the proportion of Immigrants from West Indies and percentage of family households in the United States with a correlation coefficient (R) of -0.312 and weighted average of 61.6%, a difference of 3.6%.
Family Households Correlation Summary
| Measurement | Shoshone | Immigrants from West Indies |
| Minimum | 43.8% | 44.1% |
| Maximum | 88.1% | 77.0% |
| Range | 44.3% | 32.9% |
| Mean | 67.0% | 59.3% |
| Median | 65.9% | 58.3% |
| Interquartile 25% (IQ1) | 60.9% | 52.8% |
| Interquartile 75% (IQ3) | 73.5% | 65.4% |
| Interquartile Range (IQR) | 12.6% | 12.5% |
| Standard Deviation (Sample) | 9.8% | 8.3% |
| Standard Deviation (Population) | 9.7% | 8.1% |
Similar Demographics by Family Households
Demographics Similar to Shoshone by Family Households
In terms of family households, the demographic groups most similar to Shoshone are Immigrants from Netherlands (63.8%, a difference of 0.0%), Immigrants from Thailand (63.8%, a difference of 0.010%), Immigrants from Northern Europe (63.8%, a difference of 0.020%), Celtic (63.8%, a difference of 0.060%), and Nigerian (63.9%, a difference of 0.070%).
| Demographics | Rating | Rank | Family Households |
| Immigrants | Uruguay | 12.8 /100 | #204 | Poor 63.9% |
| Brazilians | 12.4 /100 | #205 | Poor 63.9% |
| Immigrants | Lithuania | 12.1 /100 | #206 | Poor 63.9% |
| Nigerians | 11.5 /100 | #207 | Poor 63.9% |
| Immigrants | Bangladesh | 11.4 /100 | #208 | Poor 63.9% |
| Sierra Leoneans | 11.2 /100 | #209 | Poor 63.9% |
| Immigrants | Thailand | 9.6 /100 | #210 | Tragic 63.8% |
| Shoshone | 9.4 /100 | #211 | Tragic 63.8% |
| Immigrants | Netherlands | 9.4 /100 | #212 | Tragic 63.8% |
| Immigrants | Northern Europe | 8.8 /100 | #213 | Tragic 63.8% |
| Celtics | 8.0 /100 | #214 | Tragic 63.8% |
| Belgians | 7.6 /100 | #215 | Tragic 63.8% |
| Croatians | 7.3 /100 | #216 | Tragic 63.8% |
| Osage | 7.0 /100 | #217 | Tragic 63.7% |
| Marshallese | 6.9 /100 | #218 | Tragic 63.7% |
Demographics Similar to Immigrants from West Indies by Family Households
In terms of family households, the demographic groups most similar to Immigrants from West Indies are Immigrants from Serbia (61.6%, a difference of 0.010%), Tlingit-Haida (61.6%, a difference of 0.010%), Immigrants from Switzerland (61.6%, a difference of 0.010%), Alsatian (61.7%, a difference of 0.10%), and Ugandan (61.7%, a difference of 0.16%).
| Demographics | Rating | Rank | Family Households |
| Immigrants | Bosnia and Herzegovina | 0.0 /100 | #317 | Tragic 61.9% |
| Alaskan Athabascans | 0.0 /100 | #318 | Tragic 61.8% |
| Cape Verdeans | 0.0 /100 | #319 | Tragic 61.8% |
| Ugandans | 0.0 /100 | #320 | Tragic 61.7% |
| Alsatians | 0.0 /100 | #321 | Tragic 61.7% |
| Immigrants | Serbia | 0.0 /100 | #322 | Tragic 61.6% |
| Tlingit-Haida | 0.0 /100 | #323 | Tragic 61.6% |
| Immigrants | West Indies | 0.0 /100 | #324 | Tragic 61.6% |
| Immigrants | Switzerland | 0.0 /100 | #325 | Tragic 61.6% |
| Indonesians | 0.0 /100 | #326 | Tragic 61.5% |
| Blacks/African Americans | 0.0 /100 | #327 | Tragic 61.5% |
| Kiowa | 0.0 /100 | #328 | Tragic 61.4% |
| Cambodians | 0.0 /100 | #329 | Tragic 61.4% |
| Immigrants | Australia | 0.0 /100 | #330 | Tragic 61.3% |
| Immigrants | France | 0.0 /100 | #331 | Tragic 61.3% |