Shoshone vs Immigrants from Austria Family Households
COMPARE
Shoshone
Immigrants from Austria
Family Households
Family Households Comparison
Shoshone
Immigrants from Austria
63.8%
FAMILY HOUSEHOLDS
9.4/ 100
METRIC RATING
211th/ 347
METRIC RANK
63.1%
FAMILY HOUSEHOLDS
0.3/ 100
METRIC RATING
270th/ 347
METRIC RANK
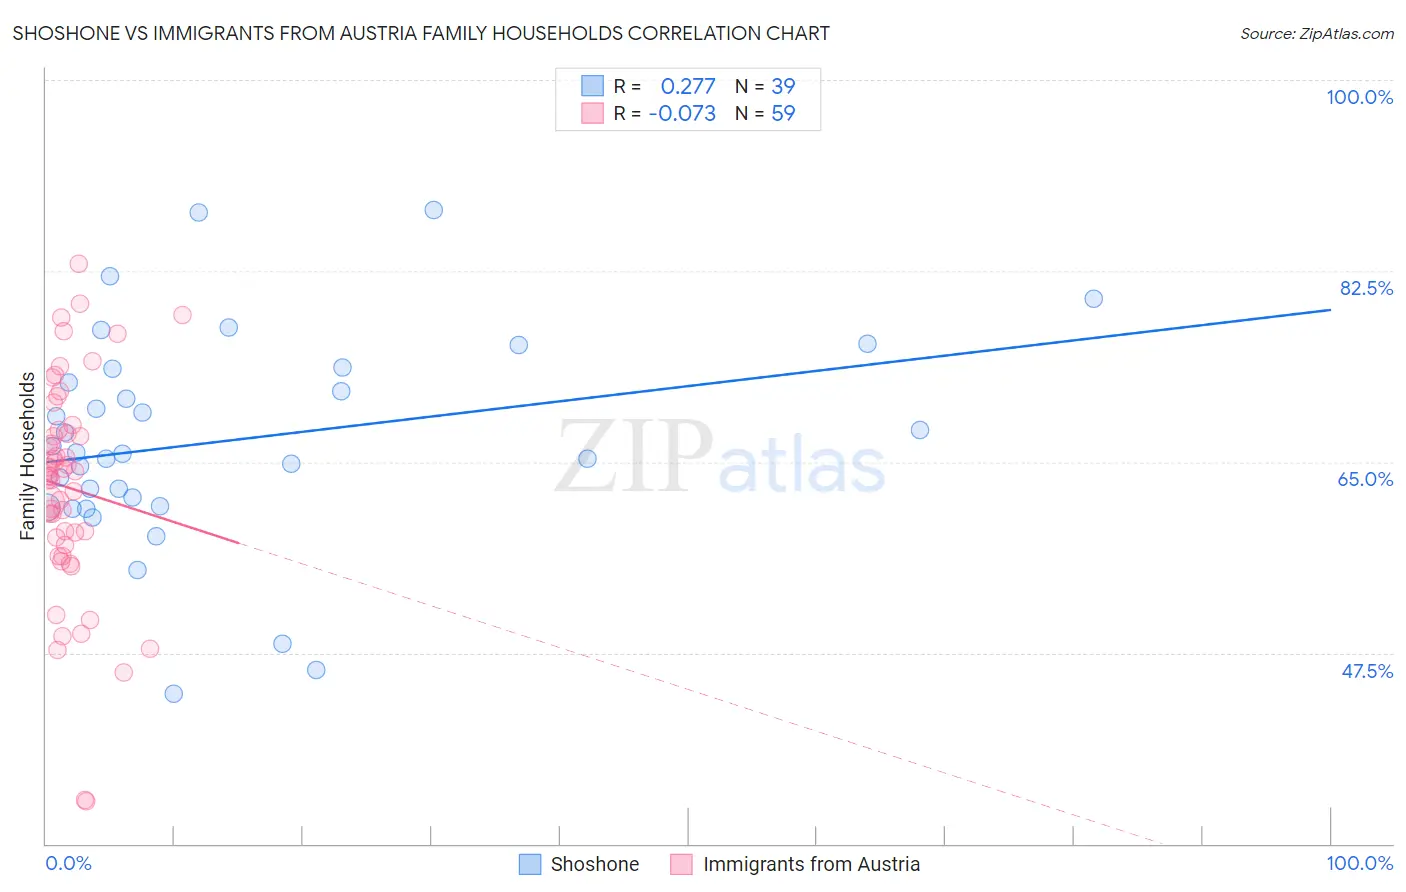
Shoshone vs Immigrants from Austria Family Households Correlation Chart
The statistical analysis conducted on geographies consisting of 66,615,877 people shows a weak positive correlation between the proportion of Shoshone and percentage of family households in the United States with a correlation coefficient (R) of 0.277 and weighted average of 63.8%. Similarly, the statistical analysis conducted on geographies consisting of 167,966,875 people shows a slight negative correlation between the proportion of Immigrants from Austria and percentage of family households in the United States with a correlation coefficient (R) of -0.073 and weighted average of 63.1%, a difference of 1.2%.
Family Households Correlation Summary
| Measurement | Shoshone | Immigrants from Austria |
| Minimum | 43.8% | 33.9% |
| Maximum | 88.1% | 83.1% |
| Range | 44.3% | 49.2% |
| Mean | 67.0% | 62.6% |
| Median | 65.9% | 63.7% |
| Interquartile 25% (IQ1) | 60.9% | 57.4% |
| Interquartile 75% (IQ3) | 73.5% | 67.9% |
| Interquartile Range (IQR) | 12.6% | 10.5% |
| Standard Deviation (Sample) | 9.8% | 10.0% |
| Standard Deviation (Population) | 9.7% | 10.0% |
Similar Demographics by Family Households
Demographics Similar to Shoshone by Family Households
In terms of family households, the demographic groups most similar to Shoshone are Immigrants from Netherlands (63.8%, a difference of 0.0%), Immigrants from Thailand (63.8%, a difference of 0.010%), Immigrants from Northern Europe (63.8%, a difference of 0.020%), Celtic (63.8%, a difference of 0.060%), and Nigerian (63.9%, a difference of 0.070%).
| Demographics | Rating | Rank | Family Households |
| Immigrants | Uruguay | 12.8 /100 | #204 | Poor 63.9% |
| Brazilians | 12.4 /100 | #205 | Poor 63.9% |
| Immigrants | Lithuania | 12.1 /100 | #206 | Poor 63.9% |
| Nigerians | 11.5 /100 | #207 | Poor 63.9% |
| Immigrants | Bangladesh | 11.4 /100 | #208 | Poor 63.9% |
| Sierra Leoneans | 11.2 /100 | #209 | Poor 63.9% |
| Immigrants | Thailand | 9.6 /100 | #210 | Tragic 63.8% |
| Shoshone | 9.4 /100 | #211 | Tragic 63.8% |
| Immigrants | Netherlands | 9.4 /100 | #212 | Tragic 63.8% |
| Immigrants | Northern Europe | 8.8 /100 | #213 | Tragic 63.8% |
| Celtics | 8.0 /100 | #214 | Tragic 63.8% |
| Belgians | 7.6 /100 | #215 | Tragic 63.8% |
| Croatians | 7.3 /100 | #216 | Tragic 63.8% |
| Osage | 7.0 /100 | #217 | Tragic 63.7% |
| Marshallese | 6.9 /100 | #218 | Tragic 63.7% |
Demographics Similar to Immigrants from Austria by Family Households
In terms of family households, the demographic groups most similar to Immigrants from Austria are Immigrants from Croatia (63.1%, a difference of 0.010%), Immigrants from Turkey (63.1%, a difference of 0.010%), Immigrants from Singapore (63.1%, a difference of 0.020%), Yugoslavian (63.1%, a difference of 0.020%), and Immigrants from Kazakhstan (63.1%, a difference of 0.020%).
| Demographics | Rating | Rank | Family Households |
| Cheyenne | 0.5 /100 | #263 | Tragic 63.2% |
| Kenyans | 0.5 /100 | #264 | Tragic 63.2% |
| Colville | 0.5 /100 | #265 | Tragic 63.2% |
| Immigrants | Western Africa | 0.5 /100 | #266 | Tragic 63.1% |
| Israelis | 0.4 /100 | #267 | Tragic 63.1% |
| Immigrants | Singapore | 0.4 /100 | #268 | Tragic 63.1% |
| Yugoslavians | 0.4 /100 | #269 | Tragic 63.1% |
| Immigrants | Austria | 0.3 /100 | #270 | Tragic 63.1% |
| Immigrants | Croatia | 0.3 /100 | #271 | Tragic 63.1% |
| Immigrants | Turkey | 0.3 /100 | #272 | Tragic 63.1% |
| Immigrants | Kazakhstan | 0.3 /100 | #273 | Tragic 63.1% |
| Lumbee | 0.3 /100 | #274 | Tragic 63.1% |
| West Indians | 0.3 /100 | #275 | Tragic 63.1% |
| Serbians | 0.3 /100 | #276 | Tragic 63.0% |
| Ottawa | 0.3 /100 | #277 | Tragic 63.0% |