Shoshone vs Basque Divorced or Separated
COMPARE
Shoshone
Basque
Divorced or Separated
Divorced or Separated Comparison
Shoshone
Basques
14.0%
DIVORCED OR SEPARATED
0.0/ 100
METRIC RATING
336th/ 347
METRIC RANK
12.6%
DIVORCED OR SEPARATED
0.5/ 100
METRIC RATING
262nd/ 347
METRIC RANK
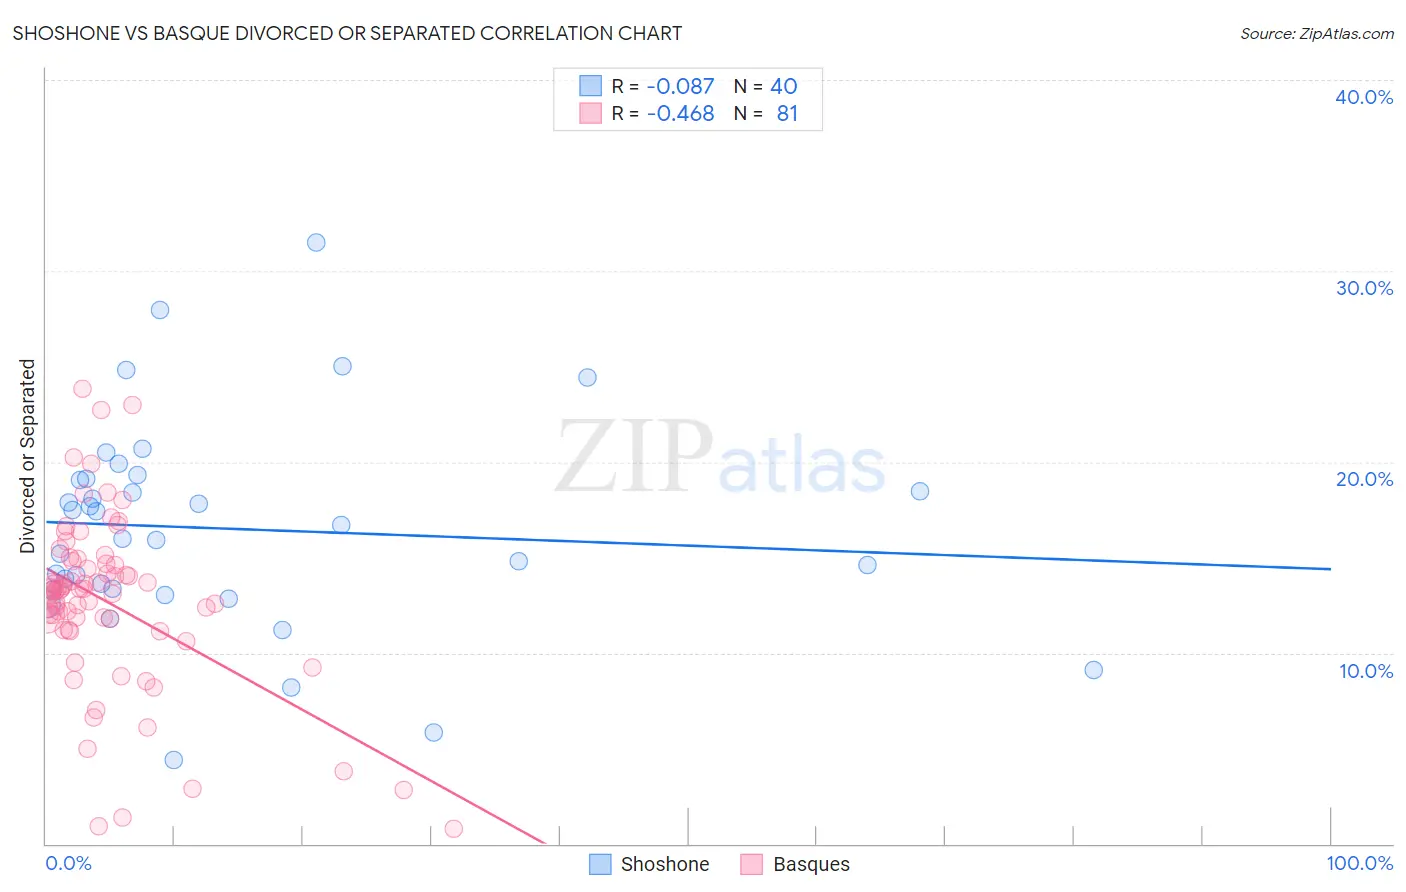
Shoshone vs Basque Divorced or Separated Correlation Chart
The statistical analysis conducted on geographies consisting of 66,626,877 people shows a slight negative correlation between the proportion of Shoshone and percentage of population currently divorced or separated in the United States with a correlation coefficient (R) of -0.087 and weighted average of 14.0%. Similarly, the statistical analysis conducted on geographies consisting of 165,751,704 people shows a moderate negative correlation between the proportion of Basques and percentage of population currently divorced or separated in the United States with a correlation coefficient (R) of -0.468 and weighted average of 12.6%, a difference of 11.4%.
Divorced or Separated Correlation Summary
| Measurement | Shoshone | Basque |
| Minimum | 4.4% | 0.80% |
| Maximum | 31.5% | 23.8% |
| Range | 27.1% | 23.0% |
| Mean | 16.5% | 12.7% |
| Median | 16.4% | 13.3% |
| Interquartile 25% (IQ1) | 13.3% | 11.2% |
| Interquartile 75% (IQ3) | 19.1% | 14.7% |
| Interquartile Range (IQR) | 5.7% | 3.5% |
| Standard Deviation (Sample) | 5.5% | 4.6% |
| Standard Deviation (Population) | 5.4% | 4.5% |
Similar Demographics by Divorced or Separated
Demographics Similar to Shoshone by Divorced or Separated
In terms of divorced or separated, the demographic groups most similar to Shoshone are Crow (14.1%, a difference of 0.28%), Dutch West Indian (14.0%, a difference of 0.34%), Choctaw (14.1%, a difference of 0.60%), Immigrants from Bahamas (13.9%, a difference of 0.95%), and Colville (14.2%, a difference of 1.1%).
| Demographics | Rating | Rank | Divorced or Separated |
| Houma | 0.0 /100 | #329 | Tragic 13.6% |
| Paiute | 0.0 /100 | #330 | Tragic 13.6% |
| Blacks/African Americans | 0.0 /100 | #331 | Tragic 13.6% |
| Cherokee | 0.0 /100 | #332 | Tragic 13.7% |
| Puerto Ricans | 0.0 /100 | #333 | Tragic 13.9% |
| Immigrants | Bahamas | 0.0 /100 | #334 | Tragic 13.9% |
| Dutch West Indians | 0.0 /100 | #335 | Tragic 14.0% |
| Shoshone | 0.0 /100 | #336 | Tragic 14.0% |
| Crow | 0.0 /100 | #337 | Tragic 14.1% |
| Choctaw | 0.0 /100 | #338 | Tragic 14.1% |
| Colville | 0.0 /100 | #339 | Tragic 14.2% |
| Chickasaw | 0.0 /100 | #340 | Tragic 14.2% |
| Bahamians | 0.0 /100 | #341 | Tragic 14.2% |
| Seminole | 0.0 /100 | #342 | Tragic 14.3% |
| Creek | 0.0 /100 | #343 | Tragic 14.4% |
Demographics Similar to Basques by Divorced or Separated
In terms of divorced or separated, the demographic groups most similar to Basques are Immigrants from Panama (12.6%, a difference of 0.050%), Immigrants from Dominica (12.6%, a difference of 0.060%), English (12.6%, a difference of 0.070%), Yuman (12.6%, a difference of 0.090%), and Immigrants from Uruguay (12.6%, a difference of 0.090%).
| Demographics | Rating | Rank | Divorced or Separated |
| Welsh | 0.7 /100 | #255 | Tragic 12.6% |
| Immigrants | Colombia | 0.6 /100 | #256 | Tragic 12.6% |
| Immigrants | Somalia | 0.6 /100 | #257 | Tragic 12.6% |
| Indonesians | 0.6 /100 | #258 | Tragic 12.6% |
| Yuman | 0.6 /100 | #259 | Tragic 12.6% |
| Immigrants | Uruguay | 0.6 /100 | #260 | Tragic 12.6% |
| Immigrants | Dominica | 0.5 /100 | #261 | Tragic 12.6% |
| Basques | 0.5 /100 | #262 | Tragic 12.6% |
| Immigrants | Panama | 0.5 /100 | #263 | Tragic 12.6% |
| English | 0.5 /100 | #264 | Tragic 12.6% |
| Immigrants | Senegal | 0.5 /100 | #265 | Tragic 12.6% |
| Whites/Caucasians | 0.5 /100 | #266 | Tragic 12.6% |
| Scottish | 0.4 /100 | #267 | Tragic 12.6% |
| Fijians | 0.4 /100 | #268 | Tragic 12.6% |
| Immigrants | Liberia | 0.4 /100 | #269 | Tragic 12.6% |