Shoshone vs Icelander Unemployment Among Ages 25 to 29 years
COMPARE
Shoshone
Icelander
Unemployment Among Ages 25 to 29 years
Unemployment Among Ages 25 to 29 years Comparison
Shoshone
Icelanders
9.2%
UNEMPLOYMENT AMONG AGES 25 TO 29 YEARS
0.0/ 100
METRIC RATING
326th/ 347
METRIC RANK
6.3%
UNEMPLOYMENT AMONG AGES 25 TO 29 YEARS
96.6/ 100
METRIC RATING
77th/ 347
METRIC RANK
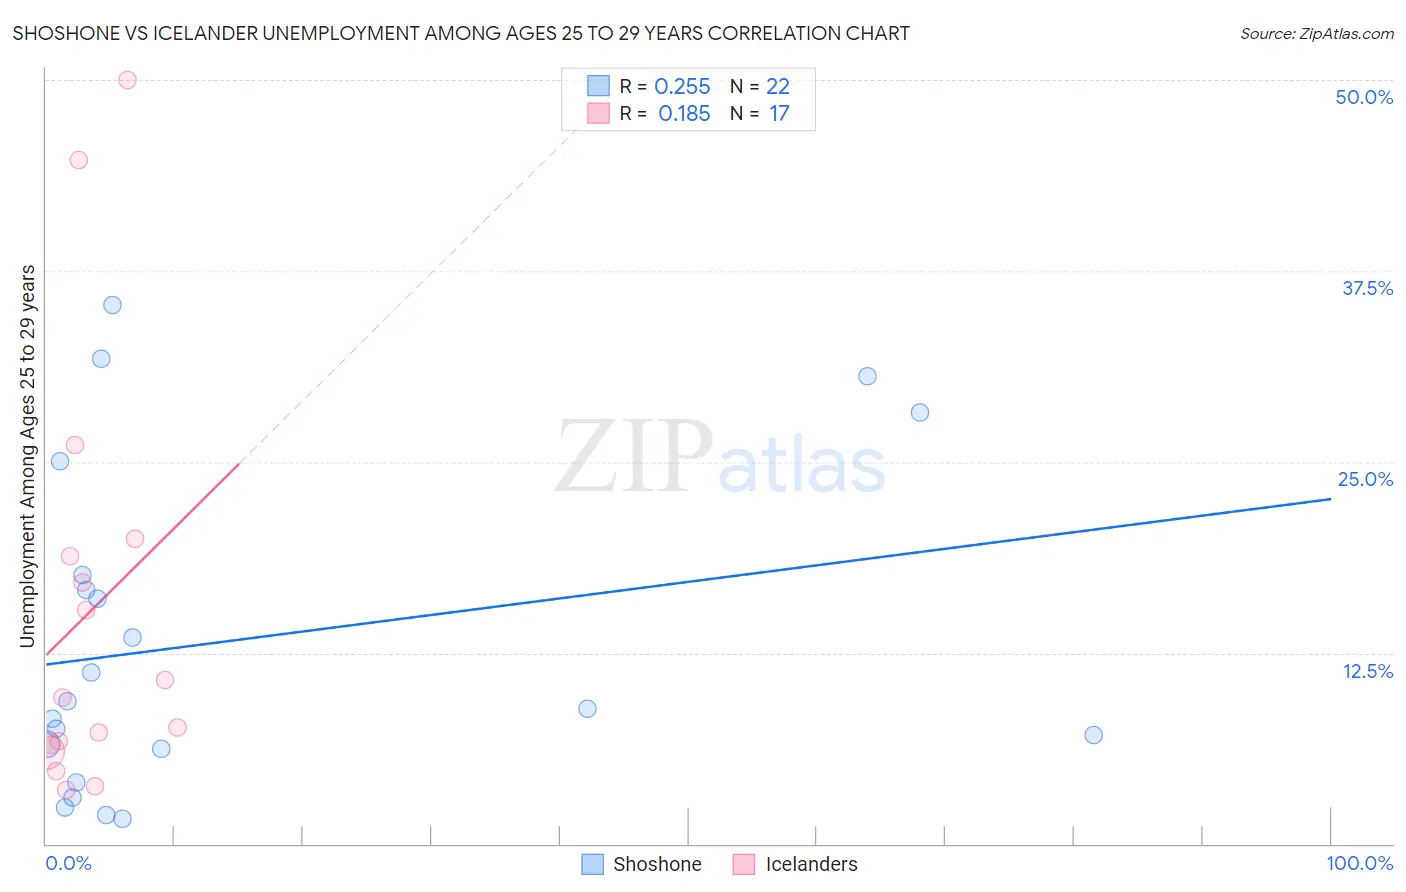
Shoshone vs Icelander Unemployment Among Ages 25 to 29 years Correlation Chart
The statistical analysis conducted on geographies consisting of 65,507,418 people shows a weak positive correlation between the proportion of Shoshone and unemployment rate among population between the ages 25 and 29 in the United States with a correlation coefficient (R) of 0.255 and weighted average of 9.2%. Similarly, the statistical analysis conducted on geographies consisting of 154,630,748 people shows a poor positive correlation between the proportion of Icelanders and unemployment rate among population between the ages 25 and 29 in the United States with a correlation coefficient (R) of 0.185 and weighted average of 6.3%, a difference of 46.4%.
Unemployment Among Ages 25 to 29 years Correlation Summary
| Measurement | Shoshone | Icelander |
| Minimum | 1.6% | 3.5% |
| Maximum | 35.2% | 50.0% |
| Range | 33.6% | 46.5% |
| Mean | 13.3% | 15.2% |
| Median | 9.1% | 9.6% |
| Interquartile 25% (IQ1) | 6.2% | 6.3% |
| Interquartile 75% (IQ3) | 17.6% | 19.4% |
| Interquartile Range (IQR) | 11.4% | 13.1% |
| Standard Deviation (Sample) | 10.5% | 13.7% |
| Standard Deviation (Population) | 10.3% | 13.3% |
Similar Demographics by Unemployment Among Ages 25 to 29 years
Demographics Similar to Shoshone by Unemployment Among Ages 25 to 29 years
In terms of unemployment among ages 25 to 29 years, the demographic groups most similar to Shoshone are Colville (9.2%, a difference of 0.16%), Apache (9.5%, a difference of 2.8%), Aleut (9.7%, a difference of 5.0%), Yakama (8.8%, a difference of 5.3%), and Houma (8.7%, a difference of 5.8%).
| Demographics | Rating | Rank | Unemployment Among Ages 25 to 29 years |
| Immigrants | Armenia | 0.0 /100 | #319 | Tragic 8.5% |
| Blacks/African Americans | 0.0 /100 | #320 | Tragic 8.6% |
| Immigrants | Dominican Republic | 0.0 /100 | #321 | Tragic 8.6% |
| Tlingit-Haida | 0.0 /100 | #322 | Tragic 8.7% |
| Dominicans | 0.0 /100 | #323 | Tragic 8.7% |
| Houma | 0.0 /100 | #324 | Tragic 8.7% |
| Yakama | 0.0 /100 | #325 | Tragic 8.8% |
| Shoshone | 0.0 /100 | #326 | Tragic 9.2% |
| Colville | 0.0 /100 | #327 | Tragic 9.2% |
| Apache | 0.0 /100 | #328 | Tragic 9.5% |
| Aleuts | 0.0 /100 | #329 | Tragic 9.7% |
| Natives/Alaskans | 0.0 /100 | #330 | Tragic 9.8% |
| Alaska Natives | 0.0 /100 | #331 | Tragic 10.2% |
| Pueblo | 0.0 /100 | #332 | Tragic 10.4% |
| Alaskan Athabascans | 0.0 /100 | #333 | Tragic 10.8% |
Demographics Similar to Icelanders by Unemployment Among Ages 25 to 29 years
In terms of unemployment among ages 25 to 29 years, the demographic groups most similar to Icelanders are Immigrants from Korea (6.3%, a difference of 0.020%), Immigrants from Jordan (6.3%, a difference of 0.080%), Asian (6.3%, a difference of 0.10%), Carpatho Rusyn (6.3%, a difference of 0.16%), and Belgian (6.3%, a difference of 0.18%).
| Demographics | Rating | Rank | Unemployment Among Ages 25 to 29 years |
| Immigrants | Malaysia | 97.5 /100 | #70 | Exceptional 6.3% |
| Immigrants | France | 97.4 /100 | #71 | Exceptional 6.3% |
| Scandinavians | 97.4 /100 | #72 | Exceptional 6.3% |
| Belgians | 97.0 /100 | #73 | Exceptional 6.3% |
| Carpatho Rusyns | 96.9 /100 | #74 | Exceptional 6.3% |
| Immigrants | Jordan | 96.8 /100 | #75 | Exceptional 6.3% |
| Immigrants | Korea | 96.7 /100 | #76 | Exceptional 6.3% |
| Icelanders | 96.6 /100 | #77 | Exceptional 6.3% |
| Asians | 96.4 /100 | #78 | Exceptional 6.3% |
| Immigrants | Switzerland | 96.0 /100 | #79 | Exceptional 6.3% |
| Immigrants | Romania | 95.9 /100 | #80 | Exceptional 6.3% |
| Iranians | 95.8 /100 | #81 | Exceptional 6.3% |
| Immigrants | Poland | 95.7 /100 | #82 | Exceptional 6.3% |
| Slovenes | 95.3 /100 | #83 | Exceptional 6.3% |
| Immigrants | Spain | 95.2 /100 | #84 | Exceptional 6.3% |