Maltese vs Alsatian Single Mother Households
COMPARE
Maltese
Alsatian
Single Mother Households
Single Mother Households Comparison
Maltese
Alsatians
5.2%
SINGLE MOTHER HOUSEHOLDS
99.9/ 100
METRIC RATING
20th/ 347
METRIC RANK
6.2%
SINGLE MOTHER HOUSEHOLDS
68.7/ 100
METRIC RATING
163rd/ 347
METRIC RANK
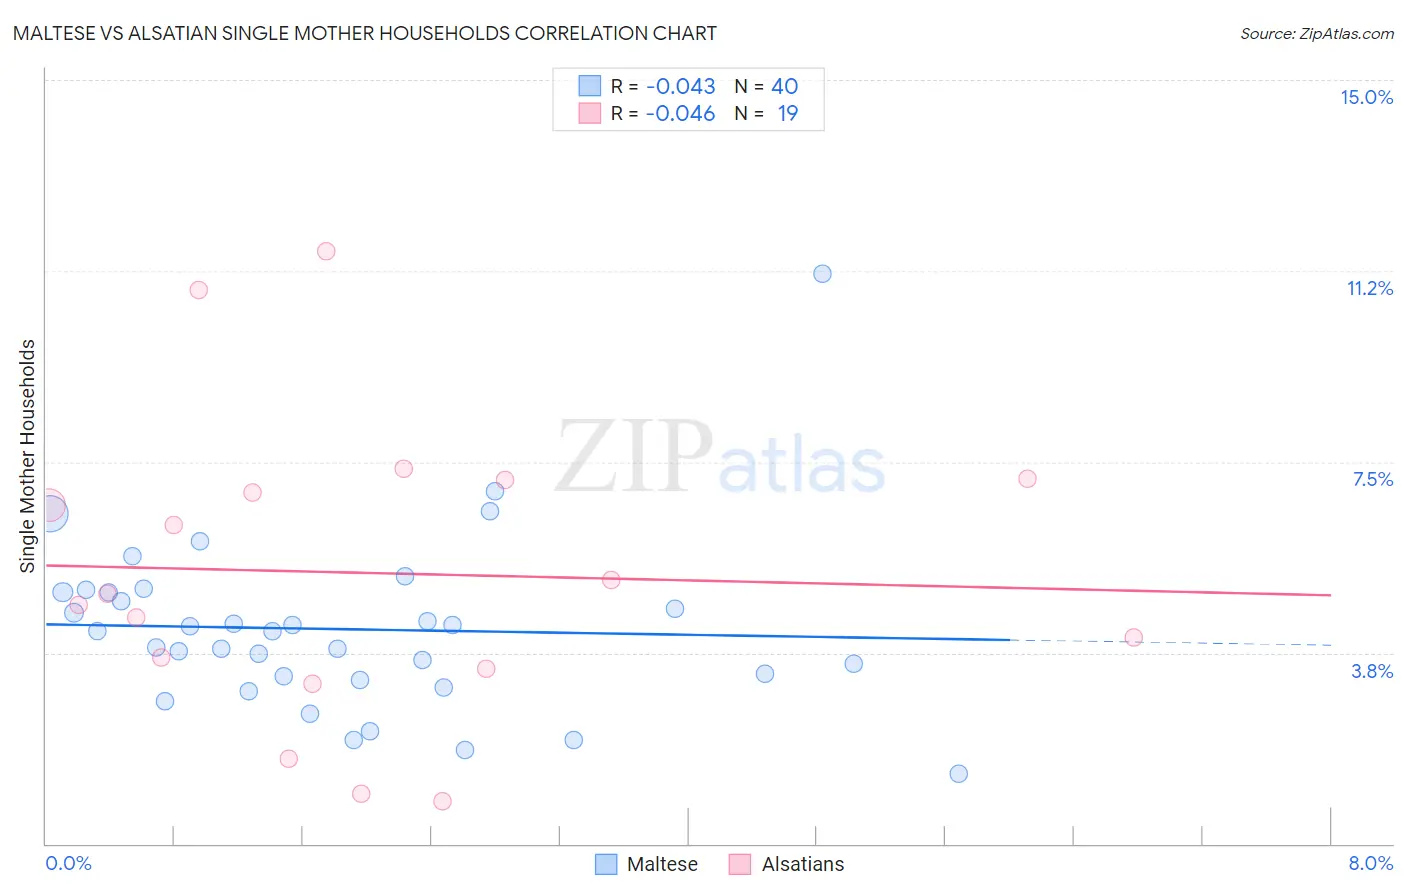
Maltese vs Alsatian Single Mother Households Correlation Chart
The statistical analysis conducted on geographies consisting of 126,155,970 people shows no correlation between the proportion of Maltese and percentage of single mother households in the United States with a correlation coefficient (R) of -0.043 and weighted average of 5.2%. Similarly, the statistical analysis conducted on geographies consisting of 82,530,360 people shows no correlation between the proportion of Alsatians and percentage of single mother households in the United States with a correlation coefficient (R) of -0.046 and weighted average of 6.2%, a difference of 19.1%.
Single Mother Households Correlation Summary
| Measurement | Maltese | Alsatian |
| Minimum | 1.4% | 0.84% |
| Maximum | 11.2% | 11.6% |
| Range | 9.8% | 10.8% |
| Mean | 4.2% | 5.3% |
| Median | 4.2% | 4.9% |
| Interquartile 25% (IQ1) | 3.3% | 3.4% |
| Interquartile 75% (IQ3) | 4.9% | 7.1% |
| Interquartile Range (IQR) | 1.7% | 3.7% |
| Standard Deviation (Sample) | 1.7% | 2.9% |
| Standard Deviation (Population) | 1.7% | 2.8% |
Similar Demographics by Single Mother Households
Demographics Similar to Maltese by Single Mother Households
In terms of single mother households, the demographic groups most similar to Maltese are Eastern European (5.2%, a difference of 0.060%), Chinese (5.2%, a difference of 0.47%), Immigrants from Armenia (5.2%, a difference of 0.57%), Thai (5.2%, a difference of 0.78%), and Immigrants from Austria (5.2%, a difference of 0.83%).
| Demographics | Rating | Rank | Single Mother Households |
| Immigrants | India | 99.9 /100 | #13 | Exceptional 5.1% |
| Immigrants | Australia | 99.9 /100 | #14 | Exceptional 5.1% |
| Immigrants | Eastern Asia | 99.9 /100 | #15 | Exceptional 5.1% |
| Indians (Asian) | 99.9 /100 | #16 | Exceptional 5.1% |
| Soviet Union | 99.9 /100 | #17 | Exceptional 5.1% |
| Immigrants | Armenia | 99.9 /100 | #18 | Exceptional 5.2% |
| Chinese | 99.9 /100 | #19 | Exceptional 5.2% |
| Maltese | 99.9 /100 | #20 | Exceptional 5.2% |
| Eastern Europeans | 99.8 /100 | #21 | Exceptional 5.2% |
| Thais | 99.8 /100 | #22 | Exceptional 5.2% |
| Immigrants | Austria | 99.8 /100 | #23 | Exceptional 5.2% |
| Armenians | 99.8 /100 | #24 | Exceptional 5.2% |
| Immigrants | Japan | 99.8 /100 | #25 | Exceptional 5.2% |
| Immigrants | Lithuania | 99.8 /100 | #26 | Exceptional 5.3% |
| Bhutanese | 99.7 /100 | #27 | Exceptional 5.3% |
Demographics Similar to Alsatians by Single Mother Households
In terms of single mother households, the demographic groups most similar to Alsatians are Immigrants from Northern Africa (6.2%, a difference of 0.090%), Immigrants from Zimbabwe (6.2%, a difference of 0.16%), Immigrants from Syria (6.2%, a difference of 0.16%), Immigrants from Germany (6.1%, a difference of 0.51%), and Iraqi (6.1%, a difference of 0.59%).
| Demographics | Rating | Rank | Single Mother Households |
| Native Hawaiians | 75.0 /100 | #156 | Good 6.1% |
| Chileans | 74.2 /100 | #157 | Good 6.1% |
| Celtics | 73.3 /100 | #158 | Good 6.1% |
| Yugoslavians | 73.1 /100 | #159 | Good 6.1% |
| Iraqis | 73.0 /100 | #160 | Good 6.1% |
| Immigrants | Germany | 72.4 /100 | #161 | Good 6.1% |
| Immigrants | Zimbabwe | 69.9 /100 | #162 | Good 6.2% |
| Alsatians | 68.7 /100 | #163 | Good 6.2% |
| Immigrants | Northern Africa | 68.0 /100 | #164 | Good 6.2% |
| Immigrants | Syria | 67.4 /100 | #165 | Good 6.2% |
| Sri Lankans | 63.9 /100 | #166 | Good 6.2% |
| Brazilians | 59.1 /100 | #167 | Average 6.2% |
| Immigrants | Chile | 58.3 /100 | #168 | Average 6.3% |
| Puget Sound Salish | 58.1 /100 | #169 | Average 6.3% |
| Immigrants | Oceania | 54.6 /100 | #170 | Average 6.3% |