Ute vs Houma Single Mother Households
COMPARE
Ute
Houma
Single Mother Households
Single Mother Households Comparison
Ute
Houma
7.1%
SINGLE MOTHER HOUSEHOLDS
1.0/ 100
METRIC RATING
236th/ 347
METRIC RANK
7.9%
SINGLE MOTHER HOUSEHOLDS
0.0/ 100
METRIC RATING
299th/ 347
METRIC RANK
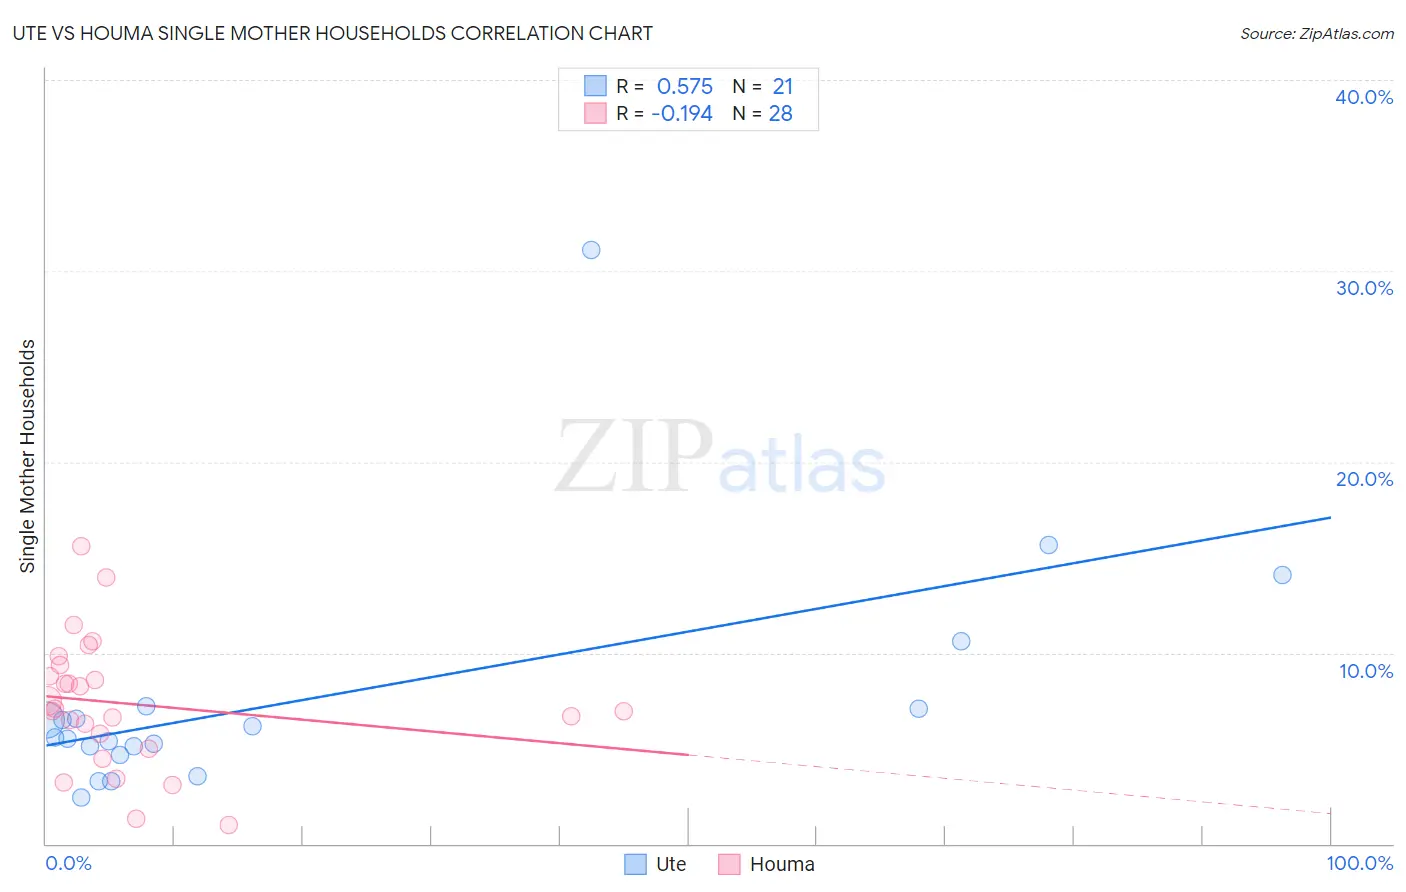
Ute vs Houma Single Mother Households Correlation Chart
The statistical analysis conducted on geographies consisting of 55,640,483 people shows a substantial positive correlation between the proportion of Ute and percentage of single mother households in the United States with a correlation coefficient (R) of 0.575 and weighted average of 7.1%. Similarly, the statistical analysis conducted on geographies consisting of 36,776,416 people shows a poor negative correlation between the proportion of Houma and percentage of single mother households in the United States with a correlation coefficient (R) of -0.194 and weighted average of 7.9%, a difference of 11.6%.
Single Mother Households Correlation Summary
| Measurement | Ute | Houma |
| Minimum | 2.4% | 1.0% |
| Maximum | 31.1% | 15.6% |
| Range | 28.6% | 14.6% |
| Mean | 7.6% | 7.3% |
| Median | 5.6% | 7.0% |
| Interquartile 25% (IQ1) | 4.9% | 5.4% |
| Interquartile 75% (IQ3) | 7.1% | 9.1% |
| Interquartile Range (IQR) | 2.3% | 3.7% |
| Standard Deviation (Sample) | 6.3% | 3.4% |
| Standard Deviation (Population) | 6.1% | 3.3% |
Similar Demographics by Single Mother Households
Demographics Similar to Ute by Single Mother Households
In terms of single mother households, the demographic groups most similar to Ute are Arapaho (7.1%, a difference of 0.090%), Panamanian (7.1%, a difference of 0.23%), Kiowa (7.1%, a difference of 0.50%), Immigrants from Burma/Myanmar (7.0%, a difference of 0.79%), and Immigrants from Panama (7.2%, a difference of 0.82%).
| Demographics | Rating | Rank | Single Mother Households |
| Immigrants | Kenya | 2.1 /100 | #229 | Tragic 7.0% |
| Creek | 1.6 /100 | #230 | Tragic 7.0% |
| Spanish Americans | 1.6 /100 | #231 | Tragic 7.0% |
| Comanche | 1.5 /100 | #232 | Tragic 7.0% |
| Choctaw | 1.4 /100 | #233 | Tragic 7.0% |
| Chickasaw | 1.4 /100 | #234 | Tragic 7.0% |
| Immigrants | Burma/Myanmar | 1.4 /100 | #235 | Tragic 7.0% |
| Ute | 1.0 /100 | #236 | Tragic 7.1% |
| Arapaho | 1.0 /100 | #237 | Tragic 7.1% |
| Panamanians | 0.9 /100 | #238 | Tragic 7.1% |
| Kiowa | 0.8 /100 | #239 | Tragic 7.1% |
| Immigrants | Panama | 0.7 /100 | #240 | Tragic 7.2% |
| Immigrants | Portugal | 0.6 /100 | #241 | Tragic 7.2% |
| Fijians | 0.6 /100 | #242 | Tragic 7.2% |
| Ecuadorians | 0.6 /100 | #243 | Tragic 7.2% |
Demographics Similar to Houma by Single Mother Households
In terms of single mother households, the demographic groups most similar to Houma are Immigrants from West Indies (7.9%, a difference of 0.080%), Hispanic or Latino (7.9%, a difference of 0.19%), Immigrants from Latin America (7.9%, a difference of 0.23%), Barbadian (7.9%, a difference of 0.30%), and Mexican (8.0%, a difference of 0.46%).
| Demographics | Rating | Rank | Single Mother Households |
| Ghanaians | 0.0 /100 | #292 | Tragic 7.8% |
| Immigrants | Cameroon | 0.0 /100 | #293 | Tragic 7.9% |
| Apache | 0.0 /100 | #294 | Tragic 7.9% |
| Barbadians | 0.0 /100 | #295 | Tragic 7.9% |
| Immigrants | Latin America | 0.0 /100 | #296 | Tragic 7.9% |
| Hispanics or Latinos | 0.0 /100 | #297 | Tragic 7.9% |
| Immigrants | West Indies | 0.0 /100 | #298 | Tragic 7.9% |
| Houma | 0.0 /100 | #299 | Tragic 7.9% |
| Mexicans | 0.0 /100 | #300 | Tragic 8.0% |
| Chippewa | 0.0 /100 | #301 | Tragic 8.0% |
| Immigrants | Ghana | 0.0 /100 | #302 | Tragic 8.0% |
| Immigrants | Bahamas | 0.0 /100 | #303 | Tragic 8.0% |
| Natives/Alaskans | 0.0 /100 | #304 | Tragic 8.0% |
| Colville | 0.0 /100 | #305 | Tragic 8.0% |
| Immigrants | Barbados | 0.0 /100 | #306 | Tragic 8.0% |