Immigrants from Egypt vs Spanish American Indian Family Households
COMPARE
Immigrants from Egypt
Spanish American Indian
Family Households
Family Households Comparison
Immigrants from Egypt
Spanish American Indians
65.3%
FAMILY HOUSEHOLDS
99.2/ 100
METRIC RATING
87th/ 347
METRIC RANK
71.2%
FAMILY HOUSEHOLDS
100.0/ 100
METRIC RATING
2nd/ 347
METRIC RANK
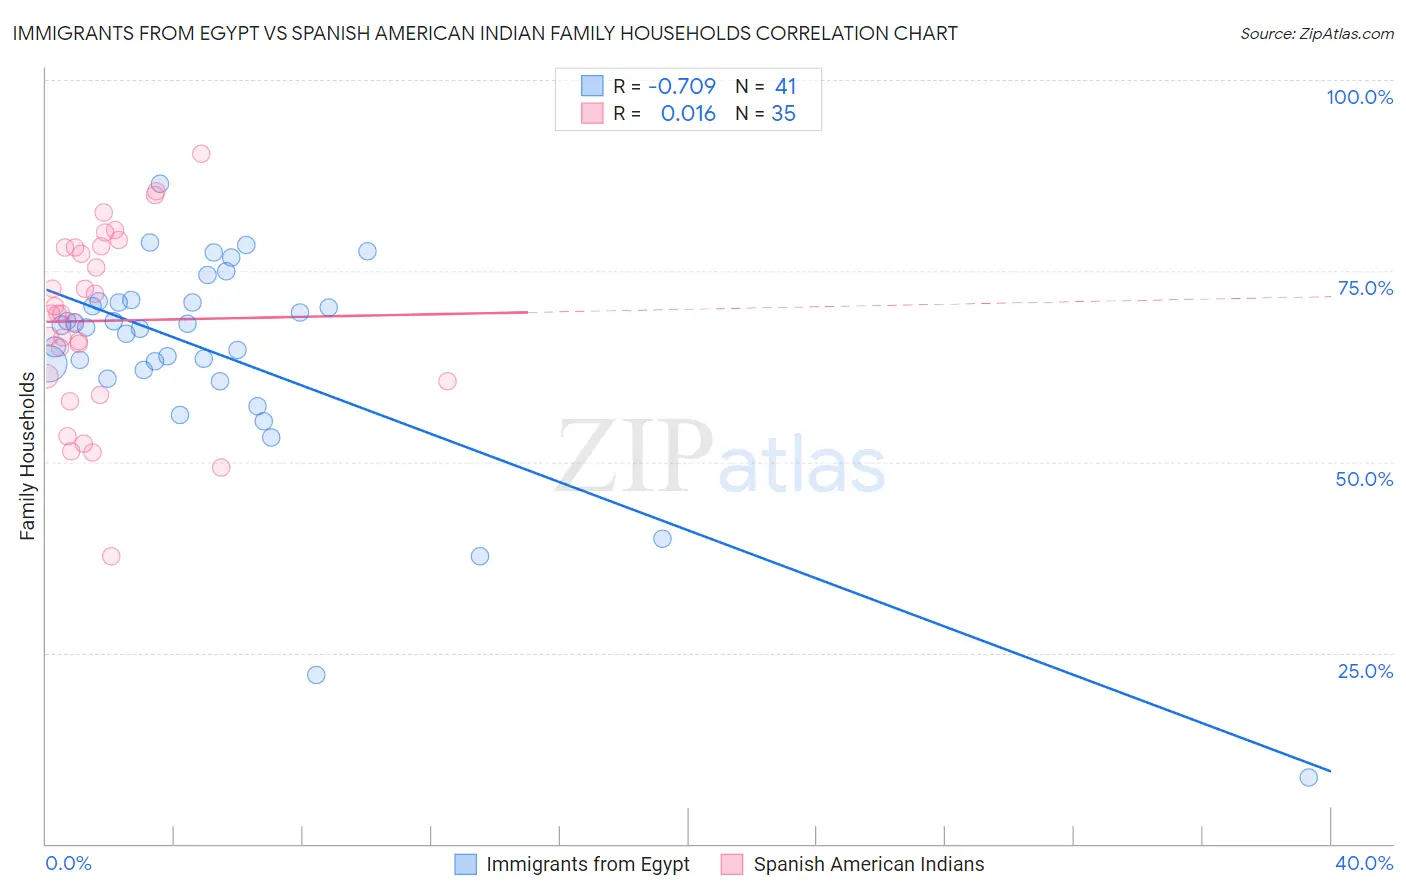
Immigrants from Egypt vs Spanish American Indian Family Households Correlation Chart
The statistical analysis conducted on geographies consisting of 245,430,680 people shows a strong negative correlation between the proportion of Immigrants from Egypt and percentage of family households in the United States with a correlation coefficient (R) of -0.709 and weighted average of 65.3%. Similarly, the statistical analysis conducted on geographies consisting of 73,145,550 people shows no correlation between the proportion of Spanish American Indians and percentage of family households in the United States with a correlation coefficient (R) of 0.016 and weighted average of 71.2%, a difference of 8.9%.
Family Households Correlation Summary
| Measurement | Immigrants from Egypt | Spanish American Indian |
| Minimum | 8.7% | 37.6% |
| Maximum | 86.5% | 90.4% |
| Range | 77.8% | 52.8% |
| Mean | 64.0% | 68.5% |
| Median | 67.6% | 69.3% |
| Interquartile 25% (IQ1) | 61.5% | 60.6% |
| Interquartile 75% (IQ3) | 71.0% | 78.1% |
| Interquartile Range (IQR) | 9.5% | 17.5% |
| Standard Deviation (Sample) | 14.6% | 11.9% |
| Standard Deviation (Population) | 14.4% | 11.8% |
Similar Demographics by Family Households
Demographics Similar to Immigrants from Egypt by Family Households
In terms of family households, the demographic groups most similar to Immigrants from Egypt are Immigrants from Haiti (65.3%, a difference of 0.030%), Immigrants from Caribbean (65.3%, a difference of 0.040%), Immigrants from Laos (65.3%, a difference of 0.050%), Egyptian (65.4%, a difference of 0.090%), and Crow (65.3%, a difference of 0.10%).
| Demographics | Rating | Rank | Family Households |
| Puget Sound Salish | 99.8 /100 | #80 | Exceptional 65.6% |
| Jordanians | 99.7 /100 | #81 | Exceptional 65.5% |
| Immigrants | Lebanon | 99.7 /100 | #82 | Exceptional 65.5% |
| Immigrants | Guyana | 99.6 /100 | #83 | Exceptional 65.5% |
| Americans | 99.6 /100 | #84 | Exceptional 65.5% |
| Immigrants | Cambodia | 99.5 /100 | #85 | Exceptional 65.4% |
| Egyptians | 99.4 /100 | #86 | Exceptional 65.4% |
| Immigrants | Egypt | 99.2 /100 | #87 | Exceptional 65.3% |
| Immigrants | Haiti | 99.1 /100 | #88 | Exceptional 65.3% |
| Immigrants | Caribbean | 99.1 /100 | #89 | Exceptional 65.3% |
| Immigrants | Laos | 99.1 /100 | #90 | Exceptional 65.3% |
| Crow | 98.9 /100 | #91 | Exceptional 65.3% |
| Hopi | 98.8 /100 | #92 | Exceptional 65.3% |
| Guyanese | 98.8 /100 | #93 | Exceptional 65.3% |
| Immigrants | Poland | 98.7 /100 | #94 | Exceptional 65.2% |
Demographics Similar to Spanish American Indians by Family Households
In terms of family households, the demographic groups most similar to Spanish American Indians are Yup'ik (72.4%, a difference of 1.8%), Tongan (69.6%, a difference of 2.2%), Yakama (69.3%, a difference of 2.7%), Yuman (69.3%, a difference of 2.7%), and Immigrants from Mexico (69.1%, a difference of 2.9%).
| Demographics | Rating | Rank | Family Households |
| Yup'ik | 100 /100 | #1 | Exceptional 72.4% |
| Spanish American Indians | 100.0 /100 | #2 | Exceptional 71.2% |
| Tongans | 100.0 /100 | #3 | Exceptional 69.6% |
| Yakama | 100.0 /100 | #4 | Exceptional 69.3% |
| Yuman | 100.0 /100 | #5 | Exceptional 69.3% |
| Immigrants | Mexico | 100.0 /100 | #6 | Exceptional 69.1% |
| Mexicans | 100.0 /100 | #7 | Exceptional 69.0% |
| Immigrants | Fiji | 100.0 /100 | #8 | Exceptional 68.8% |
| Native Hawaiians | 100.0 /100 | #9 | Exceptional 68.4% |
| Immigrants | Philippines | 100.0 /100 | #10 | Exceptional 68.3% |
| Immigrants | Central America | 100.0 /100 | #11 | Exceptional 68.3% |
| Koreans | 100.0 /100 | #12 | Exceptional 68.3% |
| Pueblo | 100.0 /100 | #13 | Exceptional 68.2% |
| Immigrants | Cuba | 100.0 /100 | #14 | Exceptional 68.2% |
| Assyrians/Chaldeans/Syriacs | 100.0 /100 | #15 | Exceptional 68.2% |