Seminole vs Spanish American Indian Unemployment Among Women with Children Under 18 years
COMPARE
Seminole
Spanish American Indian
Unemployment Among Women with Children Under 18 years
Unemployment Among Women with Children Under 18 years Comparison
Seminole
Spanish American Indians
6.0%
UNEMPLOYMENT AMONG WOMEN WITH CHILDREN UNDER 18 YEARS
0.5/ 100
METRIC RATING
252nd/ 347
METRIC RANK
6.1%
UNEMPLOYMENT AMONG WOMEN WITH CHILDREN UNDER 18 YEARS
0.1/ 100
METRIC RATING
263rd/ 347
METRIC RANK
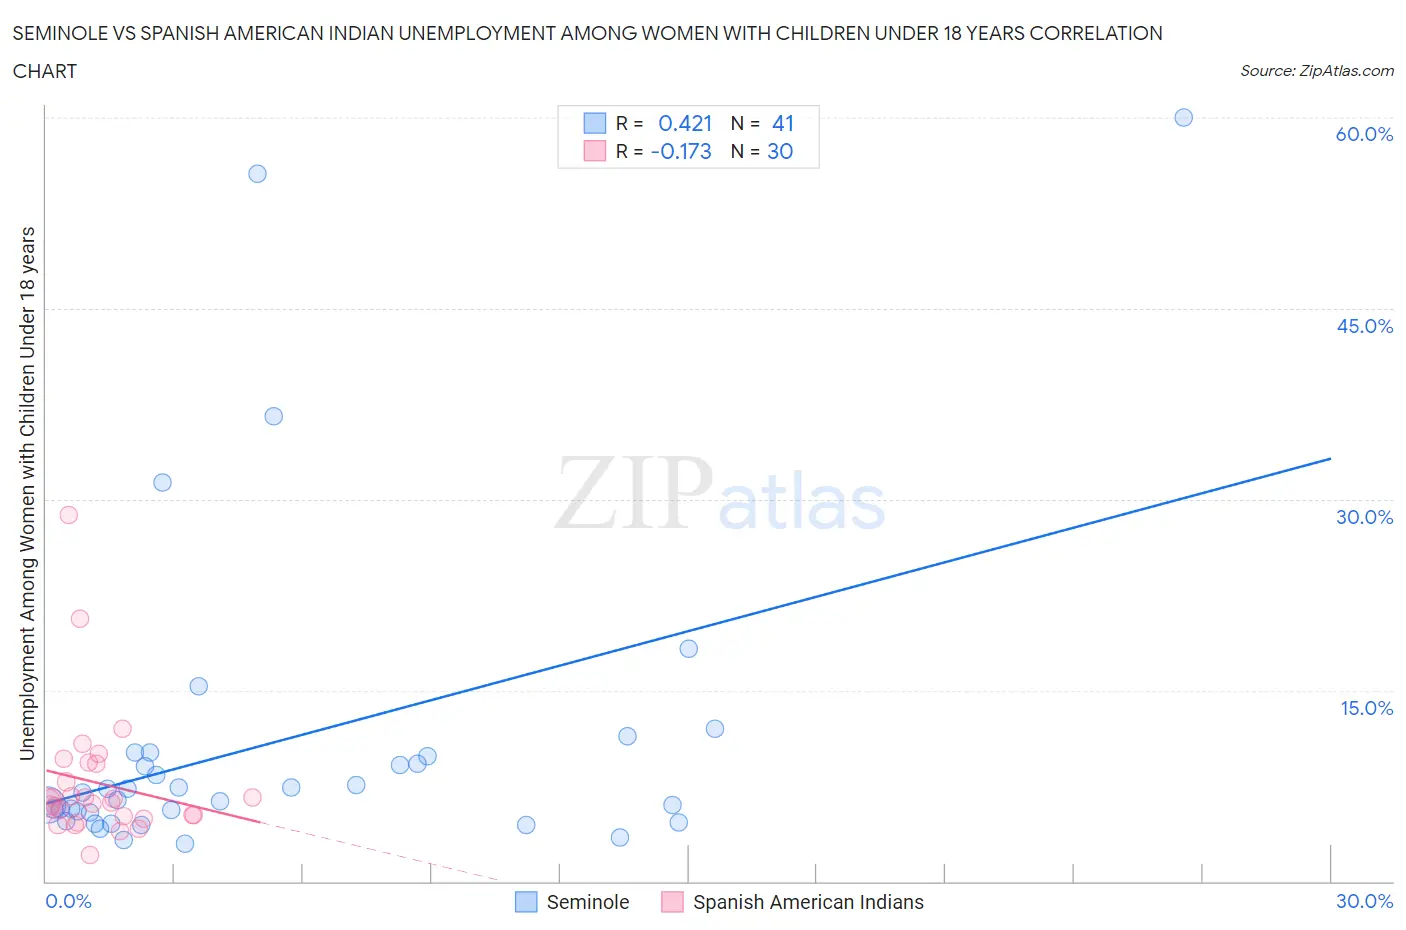
Seminole vs Spanish American Indian Unemployment Among Women with Children Under 18 years Correlation Chart
The statistical analysis conducted on geographies consisting of 116,531,030 people shows a moderate positive correlation between the proportion of Seminole and unemployment rate among women with children under the age of 18 in the United States with a correlation coefficient (R) of 0.421 and weighted average of 6.0%. Similarly, the statistical analysis conducted on geographies consisting of 72,726,948 people shows a poor negative correlation between the proportion of Spanish American Indians and unemployment rate among women with children under the age of 18 in the United States with a correlation coefficient (R) of -0.173 and weighted average of 6.1%, a difference of 3.0%.
Unemployment Among Women with Children Under 18 years Correlation Summary
| Measurement | Seminole | Spanish American Indian |
| Minimum | 3.0% | 2.1% |
| Maximum | 60.0% | 28.7% |
| Range | 57.0% | 26.6% |
| Mean | 11.0% | 7.7% |
| Median | 6.9% | 6.2% |
| Interquartile 25% (IQ1) | 5.1% | 5.1% |
| Interquartile 75% (IQ3) | 9.9% | 9.2% |
| Interquartile Range (IQR) | 4.9% | 4.1% |
| Standard Deviation (Sample) | 12.6% | 5.2% |
| Standard Deviation (Population) | 12.5% | 5.1% |
Demographics Similar to Seminole and Spanish American Indians by Unemployment Among Women with Children Under 18 years
In terms of unemployment among women with children under 18 years, the demographic groups most similar to Seminole are Immigrants from Congo (6.0%, a difference of 0.21%), Ute (5.9%, a difference of 0.62%), Immigrants from Cabo Verde (5.9%, a difference of 0.63%), Immigrants from Cameroon (5.9%, a difference of 0.70%), and Delaware (5.9%, a difference of 0.85%). Similarly, the demographic groups most similar to Spanish American Indians are Immigrants from Liberia (6.1%, a difference of 0.020%), Immigrants from Trinidad and Tobago (6.1%, a difference of 0.020%), Comanche (6.1%, a difference of 0.070%), Nigerian (6.1%, a difference of 0.12%), and Ottawa (6.1%, a difference of 0.14%).
| Demographics | Rating | Rank | Unemployment Among Women with Children Under 18 years |
| Cape Verdeans | 1.0 /100 | #247 | Tragic 5.9% |
| Delaware | 0.8 /100 | #248 | Tragic 5.9% |
| Immigrants | Cameroon | 0.8 /100 | #249 | Tragic 5.9% |
| Immigrants | Cabo Verde | 0.7 /100 | #250 | Tragic 5.9% |
| Ute | 0.7 /100 | #251 | Tragic 5.9% |
| Seminole | 0.5 /100 | #252 | Tragic 6.0% |
| Immigrants | Congo | 0.4 /100 | #253 | Tragic 6.0% |
| Immigrants | Azores | 0.3 /100 | #254 | Tragic 6.0% |
| Liberians | 0.2 /100 | #255 | Tragic 6.0% |
| Nepalese | 0.2 /100 | #256 | Tragic 6.0% |
| Bermudans | 0.1 /100 | #257 | Tragic 6.1% |
| Immigrants | Nigeria | 0.1 /100 | #258 | Tragic 6.1% |
| Ottawa | 0.1 /100 | #259 | Tragic 6.1% |
| Nigerians | 0.1 /100 | #260 | Tragic 6.1% |
| Immigrants | Liberia | 0.1 /100 | #261 | Tragic 6.1% |
| Immigrants | Trinidad and Tobago | 0.1 /100 | #262 | Tragic 6.1% |
| Spanish American Indians | 0.1 /100 | #263 | Tragic 6.1% |
| Comanche | 0.1 /100 | #264 | Tragic 6.1% |
| Immigrants | Bahamas | 0.1 /100 | #265 | Tragic 6.1% |
| Sub-Saharan Africans | 0.1 /100 | #266 | Tragic 6.2% |
| French American Indians | 0.1 /100 | #267 | Tragic 6.2% |