Immigrants from Burma/Myanmar vs Spanish American Indian Family Households
COMPARE
Immigrants from Burma/Myanmar
Spanish American Indian
Family Households
Family Households Comparison
Immigrants from Burma/Myanmar
Spanish American Indians
62.6%
FAMILY HOUSEHOLDS
0.0/ 100
METRIC RATING
292nd/ 347
METRIC RANK
71.2%
FAMILY HOUSEHOLDS
100.0/ 100
METRIC RATING
2nd/ 347
METRIC RANK
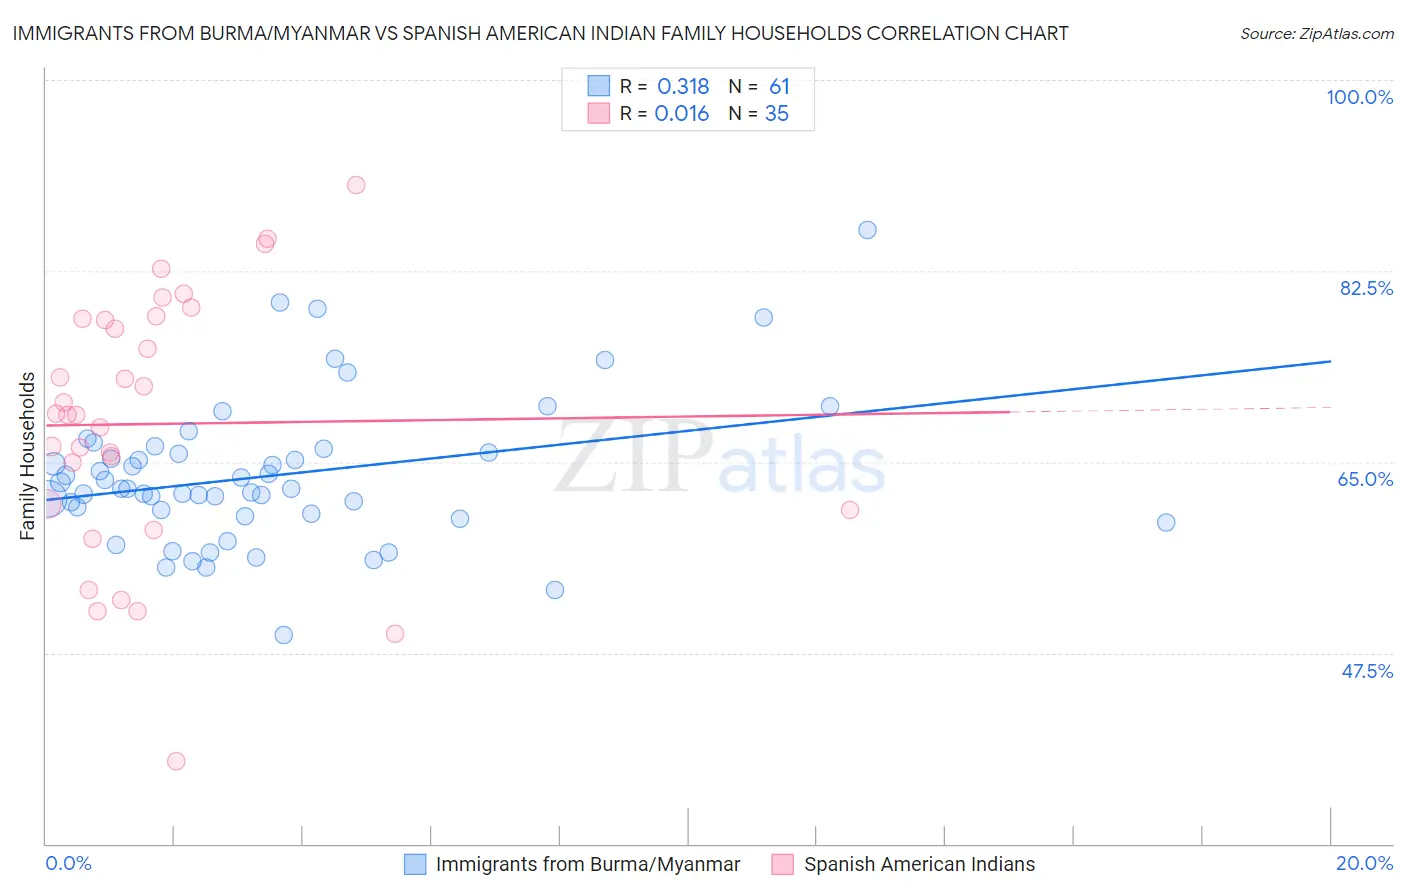
Immigrants from Burma/Myanmar vs Spanish American Indian Family Households Correlation Chart
The statistical analysis conducted on geographies consisting of 172,273,179 people shows a mild positive correlation between the proportion of Immigrants from Burma/Myanmar and percentage of family households in the United States with a correlation coefficient (R) of 0.318 and weighted average of 62.6%. Similarly, the statistical analysis conducted on geographies consisting of 73,145,550 people shows no correlation between the proportion of Spanish American Indians and percentage of family households in the United States with a correlation coefficient (R) of 0.016 and weighted average of 71.2%, a difference of 13.7%.
Family Households Correlation Summary
| Measurement | Immigrants from Burma/Myanmar | Spanish American Indian |
| Minimum | 49.1% | 37.6% |
| Maximum | 86.2% | 90.4% |
| Range | 37.1% | 52.8% |
| Mean | 63.7% | 68.5% |
| Median | 62.5% | 69.3% |
| Interquartile 25% (IQ1) | 60.1% | 60.6% |
| Interquartile 75% (IQ3) | 66.0% | 78.1% |
| Interquartile Range (IQR) | 5.9% | 17.5% |
| Standard Deviation (Sample) | 6.7% | 11.9% |
| Standard Deviation (Population) | 6.6% | 11.8% |
Similar Demographics by Family Households
Demographics Similar to Immigrants from Burma/Myanmar by Family Households
In terms of family households, the demographic groups most similar to Immigrants from Burma/Myanmar are U.S. Virgin Islander (62.6%, a difference of 0.050%), Immigrants from Grenada (62.6%, a difference of 0.10%), Immigrants from Sweden (62.5%, a difference of 0.13%), Immigrants from Nepal (62.7%, a difference of 0.18%), and Barbadian (62.5%, a difference of 0.19%).
| Demographics | Rating | Rank | Family Households |
| Mongolians | 0.1 /100 | #285 | Tragic 62.8% |
| British West Indians | 0.1 /100 | #286 | Tragic 62.8% |
| Latvians | 0.1 /100 | #287 | Tragic 62.8% |
| Immigrants | Uganda | 0.1 /100 | #288 | Tragic 62.7% |
| Immigrants | Nepal | 0.1 /100 | #289 | Tragic 62.7% |
| Immigrants | Grenada | 0.0 /100 | #290 | Tragic 62.6% |
| U.S. Virgin Islanders | 0.0 /100 | #291 | Tragic 62.6% |
| Immigrants | Burma/Myanmar | 0.0 /100 | #292 | Tragic 62.6% |
| Immigrants | Sweden | 0.0 /100 | #293 | Tragic 62.5% |
| Barbadians | 0.0 /100 | #294 | Tragic 62.5% |
| Okinawans | 0.0 /100 | #295 | Tragic 62.5% |
| Slovenes | 0.0 /100 | #296 | Tragic 62.4% |
| French American Indians | 0.0 /100 | #297 | Tragic 62.4% |
| Immigrants | Spain | 0.0 /100 | #298 | Tragic 62.4% |
| Immigrants | Kuwait | 0.0 /100 | #299 | Tragic 62.4% |
Demographics Similar to Spanish American Indians by Family Households
In terms of family households, the demographic groups most similar to Spanish American Indians are Yup'ik (72.4%, a difference of 1.8%), Tongan (69.6%, a difference of 2.2%), Yakama (69.3%, a difference of 2.7%), Yuman (69.3%, a difference of 2.7%), and Immigrants from Mexico (69.1%, a difference of 2.9%).
| Demographics | Rating | Rank | Family Households |
| Yup'ik | 100 /100 | #1 | Exceptional 72.4% |
| Spanish American Indians | 100.0 /100 | #2 | Exceptional 71.2% |
| Tongans | 100.0 /100 | #3 | Exceptional 69.6% |
| Yakama | 100.0 /100 | #4 | Exceptional 69.3% |
| Yuman | 100.0 /100 | #5 | Exceptional 69.3% |
| Immigrants | Mexico | 100.0 /100 | #6 | Exceptional 69.1% |
| Mexicans | 100.0 /100 | #7 | Exceptional 69.0% |
| Immigrants | Fiji | 100.0 /100 | #8 | Exceptional 68.8% |
| Native Hawaiians | 100.0 /100 | #9 | Exceptional 68.4% |
| Immigrants | Philippines | 100.0 /100 | #10 | Exceptional 68.3% |
| Immigrants | Central America | 100.0 /100 | #11 | Exceptional 68.3% |
| Koreans | 100.0 /100 | #12 | Exceptional 68.3% |
| Pueblo | 100.0 /100 | #13 | Exceptional 68.2% |
| Immigrants | Cuba | 100.0 /100 | #14 | Exceptional 68.2% |
| Assyrians/Chaldeans/Syriacs | 100.0 /100 | #15 | Exceptional 68.2% |