Immigrants from Sierra Leone vs Dutch West Indian Married-couple Households
COMPARE
Immigrants from Sierra Leone
Dutch West Indian
Married-couple Households
Married-couple Households Comparison
Immigrants from Sierra Leone
Dutch West Indians
43.3%
MARRIED-COUPLE HOUSEHOLDS
0.1/ 100
METRIC RATING
269th/ 347
METRIC RANK
44.9%
MARRIED-COUPLE HOUSEHOLDS
2.6/ 100
METRIC RATING
225th/ 347
METRIC RANK
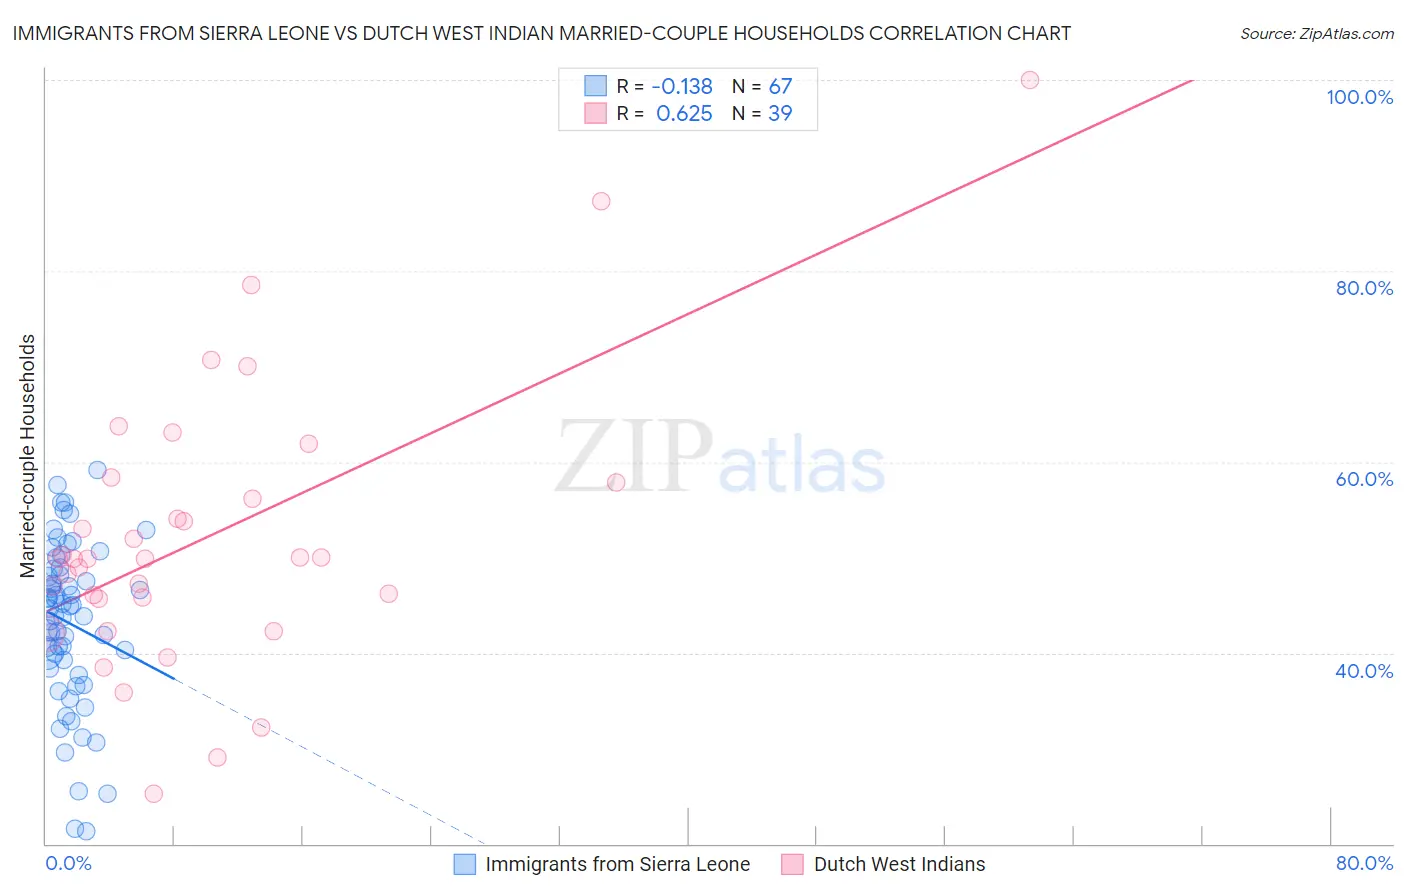
Immigrants from Sierra Leone vs Dutch West Indian Married-couple Households Correlation Chart
The statistical analysis conducted on geographies consisting of 101,644,825 people shows a poor negative correlation between the proportion of Immigrants from Sierra Leone and percentage of married-couple family households in the United States with a correlation coefficient (R) of -0.138 and weighted average of 43.3%. Similarly, the statistical analysis conducted on geographies consisting of 85,766,560 people shows a significant positive correlation between the proportion of Dutch West Indians and percentage of married-couple family households in the United States with a correlation coefficient (R) of 0.625 and weighted average of 44.9%, a difference of 3.6%.
Married-couple Households Correlation Summary
| Measurement | Immigrants from Sierra Leone | Dutch West Indian |
| Minimum | 21.3% | 25.3% |
| Maximum | 59.2% | 100.0% |
| Range | 37.9% | 74.7% |
| Mean | 43.1% | 52.1% |
| Median | 44.6% | 49.8% |
| Interquartile 25% (IQ1) | 38.3% | 45.7% |
| Interquartile 75% (IQ3) | 48.8% | 57.9% |
| Interquartile Range (IQR) | 10.5% | 12.2% |
| Standard Deviation (Sample) | 8.5% | 14.6% |
| Standard Deviation (Population) | 8.4% | 14.5% |
Similar Demographics by Married-couple Households
Demographics Similar to Immigrants from Sierra Leone by Married-couple Households
In terms of married-couple households, the demographic groups most similar to Immigrants from Sierra Leone are Yuman (43.3%, a difference of 0.050%), Guatemalan (43.3%, a difference of 0.15%), Immigrants from Burma/Myanmar (43.4%, a difference of 0.21%), Immigrants from Nigeria (43.2%, a difference of 0.26%), and Native/Alaskan (43.5%, a difference of 0.31%).
| Demographics | Rating | Rank | Married-couple Households |
| Vietnamese | 0.2 /100 | #262 | Tragic 43.6% |
| Cree | 0.1 /100 | #263 | Tragic 43.6% |
| Bangladeshis | 0.1 /100 | #264 | Tragic 43.5% |
| Moroccans | 0.1 /100 | #265 | Tragic 43.5% |
| Ecuadorians | 0.1 /100 | #266 | Tragic 43.5% |
| Natives/Alaskans | 0.1 /100 | #267 | Tragic 43.5% |
| Immigrants | Burma/Myanmar | 0.1 /100 | #268 | Tragic 43.4% |
| Immigrants | Sierra Leone | 0.1 /100 | #269 | Tragic 43.3% |
| Yuman | 0.1 /100 | #270 | Tragic 43.3% |
| Guatemalans | 0.1 /100 | #271 | Tragic 43.3% |
| Immigrants | Nigeria | 0.1 /100 | #272 | Tragic 43.2% |
| Ethiopians | 0.1 /100 | #273 | Tragic 43.2% |
| Nigerians | 0.1 /100 | #274 | Tragic 43.2% |
| Immigrants | Bangladesh | 0.0 /100 | #275 | Tragic 43.1% |
| Immigrants | Ethiopia | 0.0 /100 | #276 | Tragic 43.1% |
Demographics Similar to Dutch West Indians by Married-couple Households
In terms of married-couple households, the demographic groups most similar to Dutch West Indians are Immigrants from Micronesia (44.9%, a difference of 0.020%), Immigrants from Cambodia (44.9%, a difference of 0.040%), Alsatian (44.8%, a difference of 0.10%), Salvadoran (44.7%, a difference of 0.29%), and Kenyan (44.7%, a difference of 0.42%).
| Demographics | Rating | Rank | Married-couple Households |
| Immigrants | Azores | 5.3 /100 | #218 | Tragic 45.2% |
| Nicaraguans | 5.3 /100 | #219 | Tragic 45.2% |
| Immigrants | Thailand | 5.1 /100 | #220 | Tragic 45.2% |
| Tlingit-Haida | 4.9 /100 | #221 | Tragic 45.1% |
| Immigrants | Laos | 4.6 /100 | #222 | Tragic 45.1% |
| Immigrants | Cambodia | 2.7 /100 | #223 | Tragic 44.9% |
| Immigrants | Micronesia | 2.6 /100 | #224 | Tragic 44.9% |
| Dutch West Indians | 2.6 /100 | #225 | Tragic 44.9% |
| Alsatians | 2.3 /100 | #226 | Tragic 44.8% |
| Salvadorans | 1.9 /100 | #227 | Tragic 44.7% |
| Kenyans | 1.7 /100 | #228 | Tragic 44.7% |
| Immigrants | Latin America | 1.6 /100 | #229 | Tragic 44.7% |
| Soviet Union | 1.6 /100 | #230 | Tragic 44.6% |
| Houma | 1.5 /100 | #231 | Tragic 44.6% |
| Marshallese | 1.5 /100 | #232 | Tragic 44.6% |