Scottish vs Cuban Master's Degree
COMPARE
Scottish
Cuban
Master's Degree
Master's Degree Comparison
Scottish
Cubans
15.2%
MASTER'S DEGREE
62.7/ 100
METRIC RATING
169th/ 347
METRIC RANK
12.1%
MASTER'S DEGREE
0.3/ 100
METRIC RATING
275th/ 347
METRIC RANK
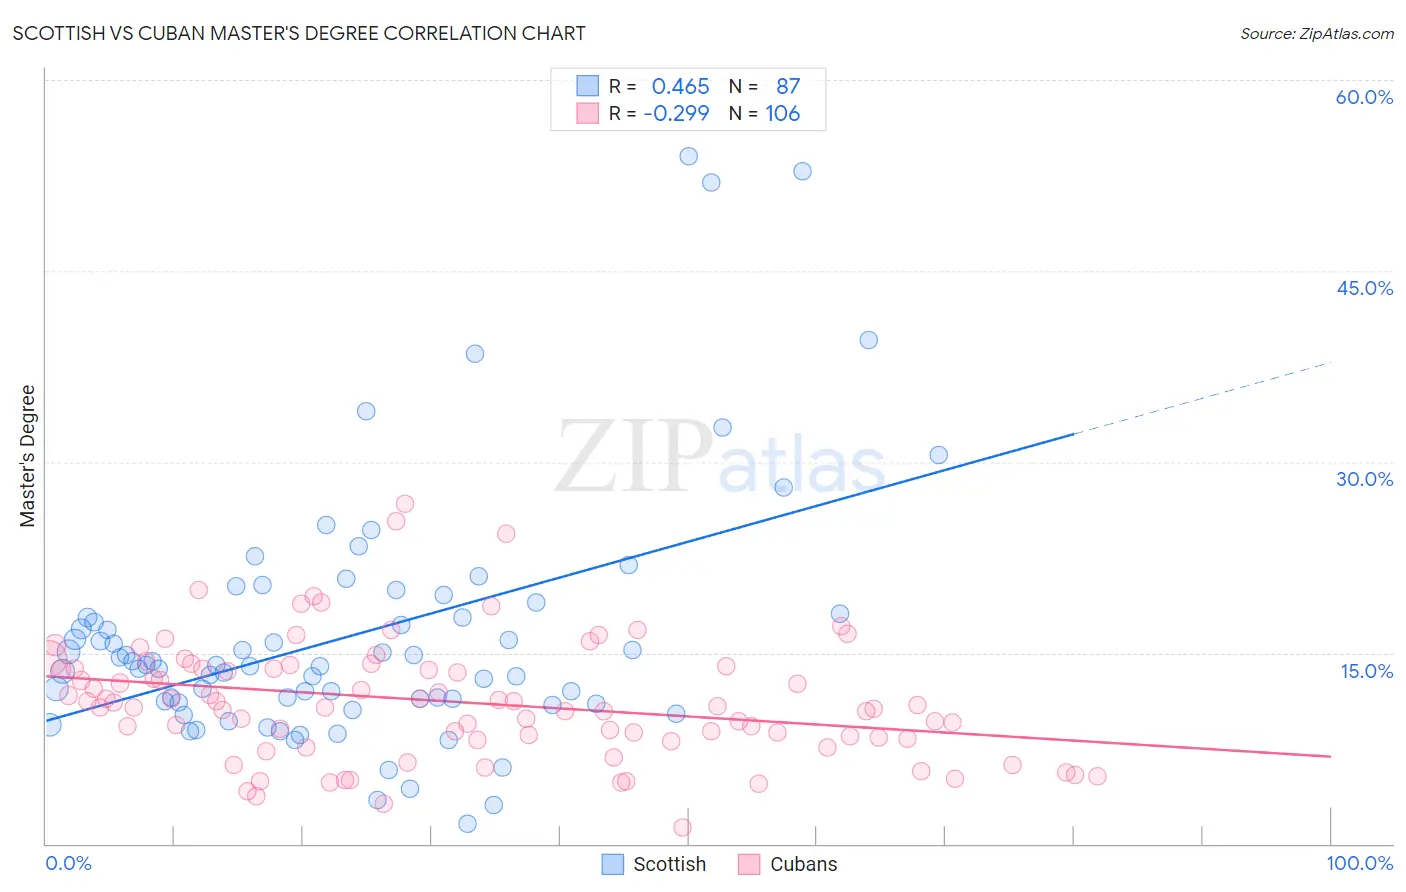
Scottish vs Cuban Master's Degree Correlation Chart
The statistical analysis conducted on geographies consisting of 566,344,578 people shows a moderate positive correlation between the proportion of Scottish and percentage of population with at least master's degree education in the United States with a correlation coefficient (R) of 0.465 and weighted average of 15.2%. Similarly, the statistical analysis conducted on geographies consisting of 449,063,887 people shows a weak negative correlation between the proportion of Cubans and percentage of population with at least master's degree education in the United States with a correlation coefficient (R) of -0.299 and weighted average of 12.1%, a difference of 25.6%.
Master's Degree Correlation Summary
| Measurement | Scottish | Cuban |
| Minimum | 1.6% | 1.3% |
| Maximum | 54.0% | 26.7% |
| Range | 52.4% | 25.4% |
| Mean | 16.4% | 11.1% |
| Median | 14.0% | 10.8% |
| Interquartile 25% (IQ1) | 11.1% | 8.3% |
| Interquartile 75% (IQ3) | 18.0% | 13.8% |
| Interquartile Range (IQR) | 7.0% | 5.5% |
| Standard Deviation (Sample) | 9.9% | 4.7% |
| Standard Deviation (Population) | 9.8% | 4.7% |
Similar Demographics by Master's Degree
Demographics Similar to Scottish by Master's Degree
In terms of master's degree, the demographic groups most similar to Scottish are Immigrants from North Macedonia (15.2%, a difference of 0.25%), Senegalese (15.2%, a difference of 0.39%), Swedish (15.2%, a difference of 0.46%), Immigrants from Kenya (15.3%, a difference of 0.54%), and Colombian (15.3%, a difference of 0.58%).
| Demographics | Rating | Rank | Master's Degree |
| Peruvians | 68.7 /100 | #162 | Good 15.3% |
| Uruguayans | 67.1 /100 | #163 | Good 15.3% |
| Colombians | 66.9 /100 | #164 | Good 15.3% |
| Immigrants | Kenya | 66.6 /100 | #165 | Good 15.3% |
| Swedes | 66.1 /100 | #166 | Good 15.2% |
| Senegalese | 65.6 /100 | #167 | Good 15.2% |
| Immigrants | North Macedonia | 64.5 /100 | #168 | Good 15.2% |
| Scottish | 62.7 /100 | #169 | Good 15.2% |
| Irish | 56.3 /100 | #170 | Average 15.0% |
| Immigrants | Ghana | 53.6 /100 | #171 | Average 15.0% |
| Immigrants | Uruguay | 52.8 /100 | #172 | Average 15.0% |
| Costa Ricans | 52.5 /100 | #173 | Average 15.0% |
| Slovaks | 50.0 /100 | #174 | Average 14.9% |
| Immigrants | Peru | 49.6 /100 | #175 | Average 14.9% |
| Nigerians | 48.6 /100 | #176 | Average 14.9% |
Demographics Similar to Cubans by Master's Degree
In terms of master's degree, the demographic groups most similar to Cubans are Cape Verdean (12.1%, a difference of 0.020%), Black/African American (12.1%, a difference of 0.050%), Immigrants from Caribbean (12.1%, a difference of 0.060%), Potawatomi (12.1%, a difference of 0.070%), and Blackfeet (12.1%, a difference of 0.10%).
| Demographics | Rating | Rank | Master's Degree |
| Native Hawaiians | 0.4 /100 | #268 | Tragic 12.3% |
| Central Americans | 0.3 /100 | #269 | Tragic 12.2% |
| Salvadorans | 0.3 /100 | #270 | Tragic 12.2% |
| Haitians | 0.3 /100 | #271 | Tragic 12.1% |
| Comanche | 0.3 /100 | #272 | Tragic 12.1% |
| Blackfeet | 0.3 /100 | #273 | Tragic 12.1% |
| Cape Verdeans | 0.3 /100 | #274 | Tragic 12.1% |
| Cubans | 0.3 /100 | #275 | Tragic 12.1% |
| Blacks/African Americans | 0.3 /100 | #276 | Tragic 12.1% |
| Immigrants | Caribbean | 0.3 /100 | #277 | Tragic 12.1% |
| Potawatomi | 0.3 /100 | #278 | Tragic 12.1% |
| Immigrants | Belize | 0.2 /100 | #279 | Tragic 12.1% |
| Immigrants | Dominican Republic | 0.2 /100 | #280 | Tragic 12.1% |
| Malaysians | 0.2 /100 | #281 | Tragic 12.0% |
| Immigrants | El Salvador | 0.2 /100 | #282 | Tragic 12.0% |