Scotch-Irish vs Serbian Family Households with Children
COMPARE
Scotch-Irish
Serbian
Family Households with Children
Family Households with Children Comparison
Scotch-Irish
Serbians
26.8%
FAMILY HOUSEHOLDS WITH CHILDREN
1.4/ 100
METRIC RATING
256th/ 347
METRIC RANK
26.4%
FAMILY HOUSEHOLDS WITH CHILDREN
0.1/ 100
METRIC RATING
302nd/ 347
METRIC RANK
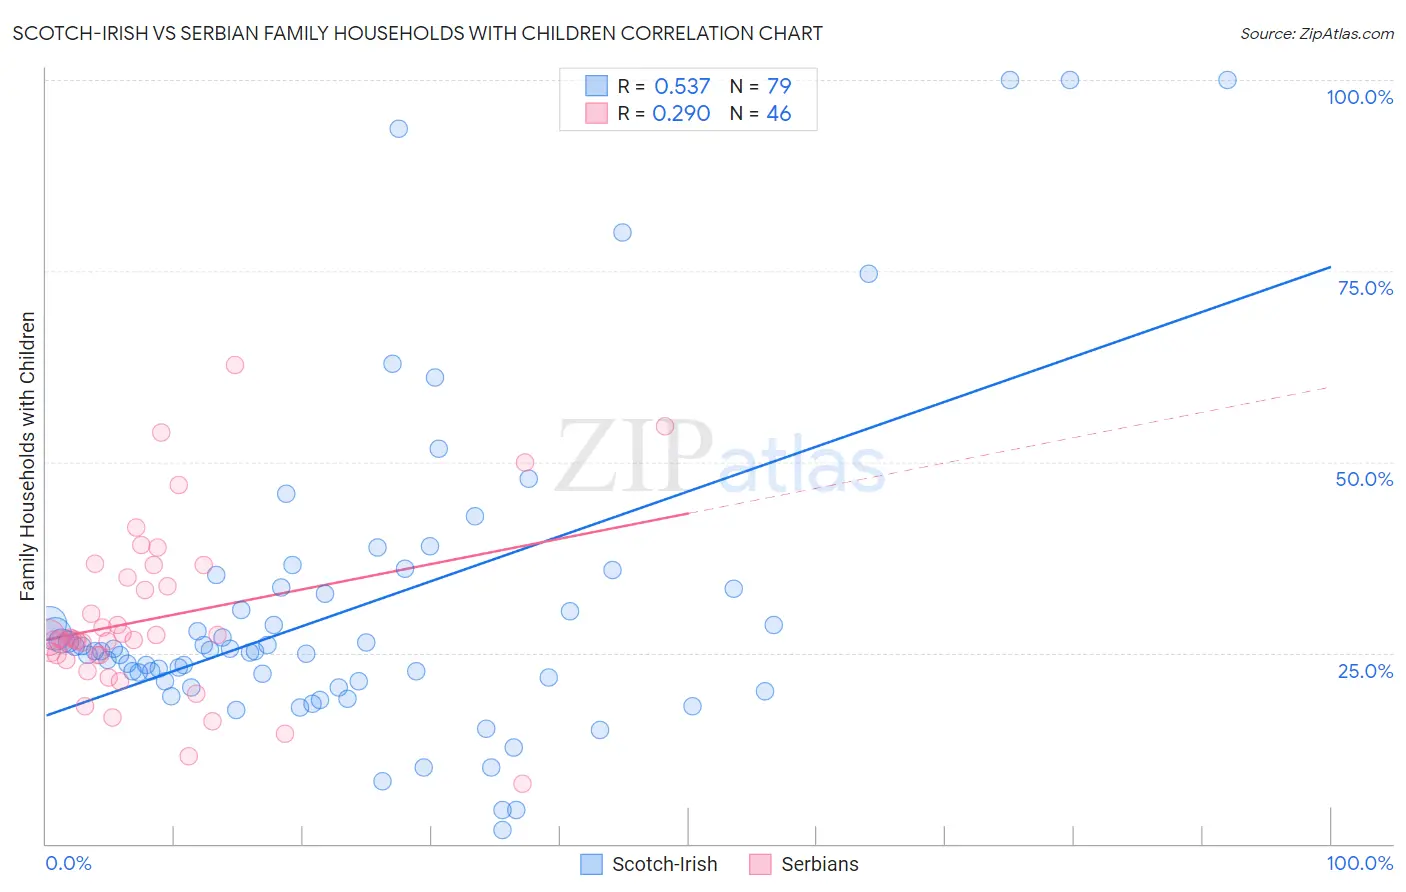
Scotch-Irish vs Serbian Family Households with Children Correlation Chart
The statistical analysis conducted on geographies consisting of 548,065,437 people shows a substantial positive correlation between the proportion of Scotch-Irish and percentage of family households with children in the United States with a correlation coefficient (R) of 0.537 and weighted average of 26.8%. Similarly, the statistical analysis conducted on geographies consisting of 267,409,875 people shows a weak positive correlation between the proportion of Serbians and percentage of family households with children in the United States with a correlation coefficient (R) of 0.290 and weighted average of 26.4%, a difference of 1.7%.
Family Households with Children Correlation Summary
| Measurement | Scotch-Irish | Serbian |
| Minimum | 1.9% | 7.8% |
| Maximum | 100.0% | 62.7% |
| Range | 98.1% | 54.8% |
| Mean | 30.8% | 29.5% |
| Median | 25.3% | 26.8% |
| Interquartile 25% (IQ1) | 21.2% | 24.7% |
| Interquartile 75% (IQ3) | 33.3% | 34.8% |
| Interquartile Range (IQR) | 12.1% | 10.1% |
| Standard Deviation (Sample) | 20.6% | 11.1% |
| Standard Deviation (Population) | 20.5% | 11.0% |
Similar Demographics by Family Households with Children
Demographics Similar to Scotch-Irish by Family Households with Children
In terms of family households with children, the demographic groups most similar to Scotch-Irish are German Russian (26.8%, a difference of 0.010%), Immigrants from Scotland (26.8%, a difference of 0.020%), Italian (26.8%, a difference of 0.050%), Slavic (26.8%, a difference of 0.050%), and Immigrants from Cuba (26.8%, a difference of 0.050%).
| Demographics | Rating | Rank | Family Households with Children |
| Immigrants | Eastern Europe | 2.1 /100 | #249 | Tragic 26.9% |
| Belgians | 2.1 /100 | #250 | Tragic 26.9% |
| Immigrants | Bosnia and Herzegovina | 1.9 /100 | #251 | Tragic 26.8% |
| Irish | 1.8 /100 | #252 | Tragic 26.8% |
| Italians | 1.5 /100 | #253 | Tragic 26.8% |
| Immigrants | Scotland | 1.5 /100 | #254 | Tragic 26.8% |
| German Russians | 1.5 /100 | #255 | Tragic 26.8% |
| Scotch-Irish | 1.4 /100 | #256 | Tragic 26.8% |
| Slavs | 1.3 /100 | #257 | Tragic 26.8% |
| Immigrants | Cuba | 1.3 /100 | #258 | Tragic 26.8% |
| Immigrants | Lithuania | 1.2 /100 | #259 | Tragic 26.8% |
| Immigrants | Jamaica | 1.2 /100 | #260 | Tragic 26.8% |
| Immigrants | Belarus | 1.1 /100 | #261 | Tragic 26.8% |
| Immigrants | Russia | 1.0 /100 | #262 | Tragic 26.8% |
| Immigrants | North Macedonia | 1.0 /100 | #263 | Tragic 26.7% |
Demographics Similar to Serbians by Family Households with Children
In terms of family households with children, the demographic groups most similar to Serbians are Immigrants from Trinidad and Tobago (26.4%, a difference of 0.010%), Paiute (26.4%, a difference of 0.030%), Immigrants from Guyana (26.3%, a difference of 0.030%), Immigrants from Bahamas (26.3%, a difference of 0.080%), and Guyanese (26.3%, a difference of 0.11%).
| Demographics | Rating | Rank | Family Households with Children |
| Macedonians | 0.1 /100 | #295 | Tragic 26.4% |
| Croatians | 0.1 /100 | #296 | Tragic 26.4% |
| Armenians | 0.1 /100 | #297 | Tragic 26.4% |
| Immigrants | Western Europe | 0.1 /100 | #298 | Tragic 26.4% |
| Trinidadians and Tobagonians | 0.1 /100 | #299 | Tragic 26.4% |
| Paiute | 0.1 /100 | #300 | Tragic 26.4% |
| Immigrants | Trinidad and Tobago | 0.1 /100 | #301 | Tragic 26.4% |
| Serbians | 0.1 /100 | #302 | Tragic 26.4% |
| Immigrants | Guyana | 0.1 /100 | #303 | Tragic 26.3% |
| Immigrants | Bahamas | 0.1 /100 | #304 | Tragic 26.3% |
| Guyanese | 0.1 /100 | #305 | Tragic 26.3% |
| Bermudans | 0.1 /100 | #306 | Tragic 26.3% |
| West Indians | 0.0 /100 | #307 | Tragic 26.3% |
| Lumbee | 0.0 /100 | #308 | Tragic 26.3% |
| Immigrants | Somalia | 0.0 /100 | #309 | Tragic 26.3% |