Scotch-Irish vs Immigrants from Brazil Family Households with Children
COMPARE
Scotch-Irish
Immigrants from Brazil
Family Households with Children
Family Households with Children Comparison
Scotch-Irish
Immigrants from Brazil
26.8%
FAMILY HOUSEHOLDS WITH CHILDREN
1.4/ 100
METRIC RATING
256th/ 347
METRIC RANK
27.4%
FAMILY HOUSEHOLDS WITH CHILDREN
40.6/ 100
METRIC RATING
186th/ 347
METRIC RANK
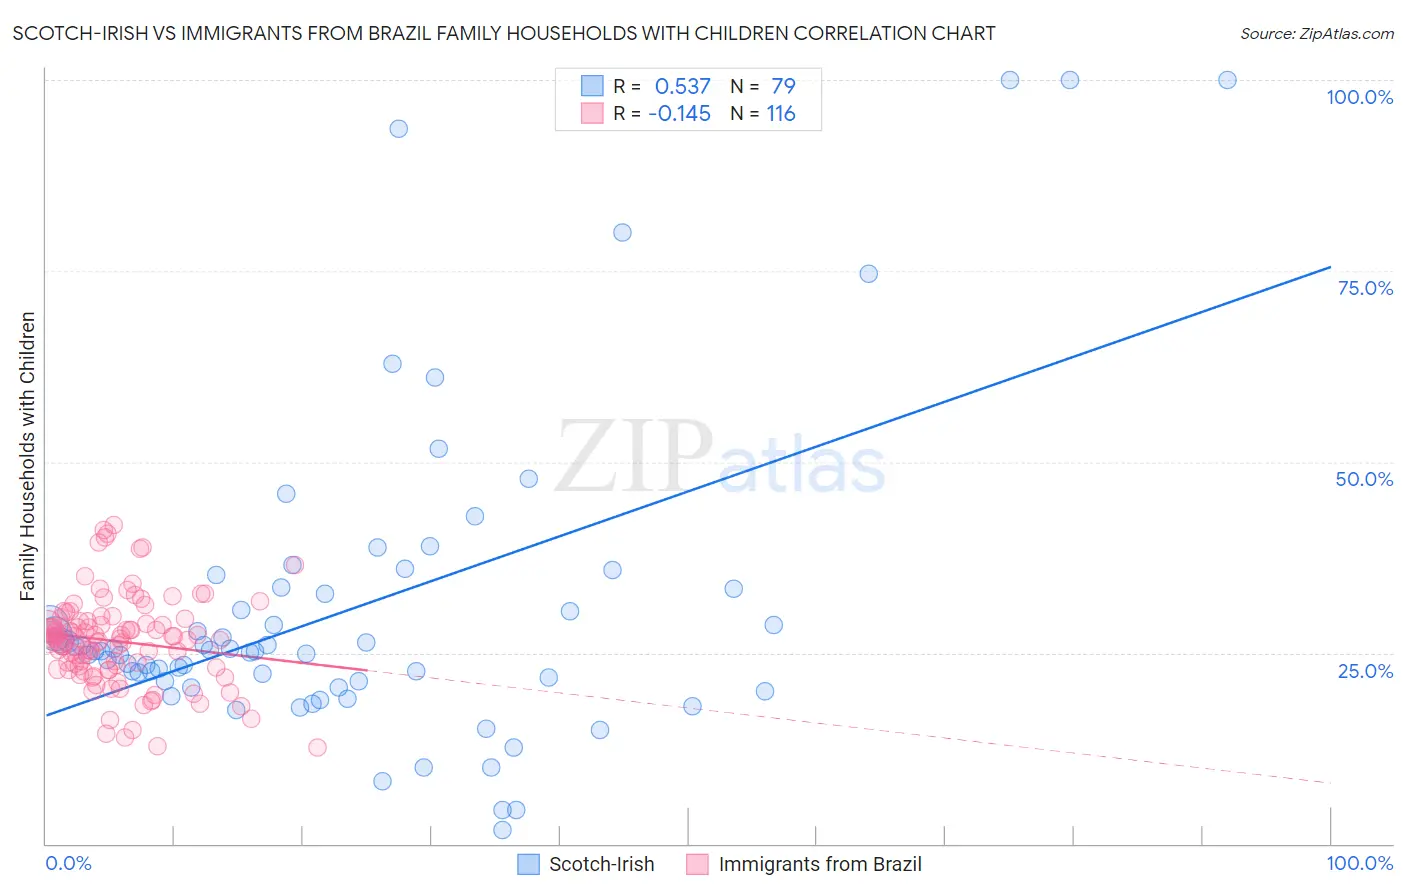
Scotch-Irish vs Immigrants from Brazil Family Households with Children Correlation Chart
The statistical analysis conducted on geographies consisting of 548,065,437 people shows a substantial positive correlation between the proportion of Scotch-Irish and percentage of family households with children in the United States with a correlation coefficient (R) of 0.537 and weighted average of 26.8%. Similarly, the statistical analysis conducted on geographies consisting of 342,742,335 people shows a poor negative correlation between the proportion of Immigrants from Brazil and percentage of family households with children in the United States with a correlation coefficient (R) of -0.145 and weighted average of 27.4%, a difference of 2.2%.
Family Households with Children Correlation Summary
| Measurement | Scotch-Irish | Immigrants from Brazil |
| Minimum | 1.9% | 12.7% |
| Maximum | 100.0% | 41.7% |
| Range | 98.1% | 29.1% |
| Mean | 30.8% | 26.5% |
| Median | 25.3% | 26.9% |
| Interquartile 25% (IQ1) | 21.2% | 22.9% |
| Interquartile 75% (IQ3) | 33.3% | 29.1% |
| Interquartile Range (IQR) | 12.1% | 6.2% |
| Standard Deviation (Sample) | 20.6% | 5.9% |
| Standard Deviation (Population) | 20.5% | 5.9% |
Similar Demographics by Family Households with Children
Demographics Similar to Scotch-Irish by Family Households with Children
In terms of family households with children, the demographic groups most similar to Scotch-Irish are German Russian (26.8%, a difference of 0.010%), Immigrants from Scotland (26.8%, a difference of 0.020%), Italian (26.8%, a difference of 0.050%), Slavic (26.8%, a difference of 0.050%), and Immigrants from Cuba (26.8%, a difference of 0.050%).
| Demographics | Rating | Rank | Family Households with Children |
| Immigrants | Eastern Europe | 2.1 /100 | #249 | Tragic 26.9% |
| Belgians | 2.1 /100 | #250 | Tragic 26.9% |
| Immigrants | Bosnia and Herzegovina | 1.9 /100 | #251 | Tragic 26.8% |
| Irish | 1.8 /100 | #252 | Tragic 26.8% |
| Italians | 1.5 /100 | #253 | Tragic 26.8% |
| Immigrants | Scotland | 1.5 /100 | #254 | Tragic 26.8% |
| German Russians | 1.5 /100 | #255 | Tragic 26.8% |
| Scotch-Irish | 1.4 /100 | #256 | Tragic 26.8% |
| Slavs | 1.3 /100 | #257 | Tragic 26.8% |
| Immigrants | Cuba | 1.3 /100 | #258 | Tragic 26.8% |
| Immigrants | Lithuania | 1.2 /100 | #259 | Tragic 26.8% |
| Immigrants | Jamaica | 1.2 /100 | #260 | Tragic 26.8% |
| Immigrants | Belarus | 1.1 /100 | #261 | Tragic 26.8% |
| Immigrants | Russia | 1.0 /100 | #262 | Tragic 26.8% |
| Immigrants | North Macedonia | 1.0 /100 | #263 | Tragic 26.7% |
Demographics Similar to Immigrants from Brazil by Family Households with Children
In terms of family households with children, the demographic groups most similar to Immigrants from Brazil are Creek (27.4%, a difference of 0.020%), Delaware (27.4%, a difference of 0.030%), Dutch (27.4%, a difference of 0.040%), Immigrants from Israel (27.4%, a difference of 0.060%), and Immigrants from Uruguay (27.4%, a difference of 0.070%).
| Demographics | Rating | Rank | Family Households with Children |
| Turks | 46.9 /100 | #179 | Average 27.4% |
| Immigrants | Turkey | 46.9 /100 | #180 | Average 27.4% |
| Aleuts | 46.7 /100 | #181 | Average 27.4% |
| Puget Sound Salish | 46.2 /100 | #182 | Average 27.4% |
| South Africans | 44.9 /100 | #183 | Average 27.4% |
| Native Hawaiians | 44.6 /100 | #184 | Average 27.4% |
| Delaware | 42.0 /100 | #185 | Average 27.4% |
| Immigrants | Brazil | 40.6 /100 | #186 | Average 27.4% |
| Creek | 39.8 /100 | #187 | Fair 27.4% |
| Dutch | 38.8 /100 | #188 | Fair 27.4% |
| Immigrants | Israel | 37.9 /100 | #189 | Fair 27.4% |
| Immigrants | Uruguay | 37.7 /100 | #190 | Fair 27.4% |
| Sudanese | 37.6 /100 | #191 | Fair 27.4% |
| Pennsylvania Germans | 37.5 /100 | #192 | Fair 27.4% |
| Swedes | 36.9 /100 | #193 | Fair 27.4% |