Immigrants from Sri Lanka vs Serbian Family Households with Children
COMPARE
Immigrants from Sri Lanka
Serbian
Family Households with Children
Family Households with Children Comparison
Immigrants from Sri Lanka
Serbians
28.4%
FAMILY HOUSEHOLDS WITH CHILDREN
99.9/ 100
METRIC RATING
76th/ 347
METRIC RANK
26.4%
FAMILY HOUSEHOLDS WITH CHILDREN
0.1/ 100
METRIC RATING
302nd/ 347
METRIC RANK
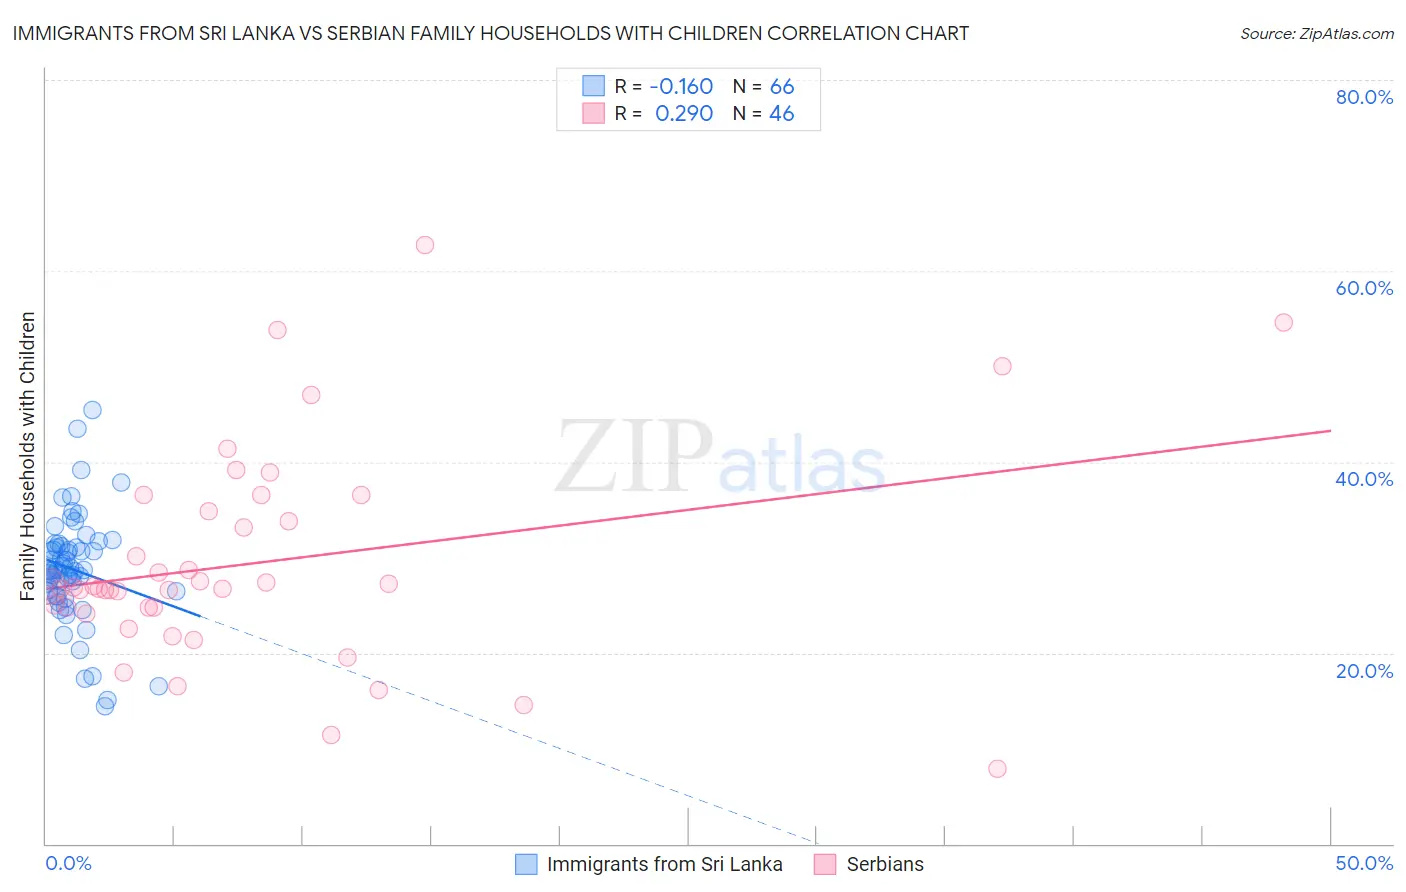
Immigrants from Sri Lanka vs Serbian Family Households with Children Correlation Chart
The statistical analysis conducted on geographies consisting of 149,648,507 people shows a poor negative correlation between the proportion of Immigrants from Sri Lanka and percentage of family households with children in the United States with a correlation coefficient (R) of -0.160 and weighted average of 28.4%. Similarly, the statistical analysis conducted on geographies consisting of 267,409,875 people shows a weak positive correlation between the proportion of Serbians and percentage of family households with children in the United States with a correlation coefficient (R) of 0.290 and weighted average of 26.4%, a difference of 7.9%.
Family Households with Children Correlation Summary
| Measurement | Immigrants from Sri Lanka | Serbian |
| Minimum | 14.3% | 7.8% |
| Maximum | 45.4% | 62.7% |
| Range | 31.1% | 54.8% |
| Mean | 28.7% | 29.5% |
| Median | 28.7% | 26.8% |
| Interquartile 25% (IQ1) | 26.2% | 24.7% |
| Interquartile 75% (IQ3) | 31.2% | 34.8% |
| Interquartile Range (IQR) | 5.0% | 10.1% |
| Standard Deviation (Sample) | 5.7% | 11.1% |
| Standard Deviation (Population) | 5.7% | 11.0% |
Similar Demographics by Family Households with Children
Demographics Similar to Immigrants from Sri Lanka by Family Households with Children
In terms of family households with children, the demographic groups most similar to Immigrants from Sri Lanka are Immigrants from Jordan (28.4%, a difference of 0.010%), Nigerian (28.4%, a difference of 0.050%), Immigrants from Nepal (28.4%, a difference of 0.090%), Immigrants from Iraq (28.4%, a difference of 0.12%), and Native/Alaskan (28.4%, a difference of 0.13%).
| Demographics | Rating | Rank | Family Households with Children |
| Immigrants | Korea | 99.9 /100 | #69 | Exceptional 28.5% |
| Immigrants | Honduras | 99.9 /100 | #70 | Exceptional 28.5% |
| Burmese | 99.9 /100 | #71 | Exceptional 28.5% |
| Immigrants | Indonesia | 99.9 /100 | #72 | Exceptional 28.5% |
| Iraqis | 99.9 /100 | #73 | Exceptional 28.5% |
| Laotians | 99.9 /100 | #74 | Exceptional 28.5% |
| Immigrants | Jordan | 99.9 /100 | #75 | Exceptional 28.4% |
| Immigrants | Sri Lanka | 99.9 /100 | #76 | Exceptional 28.4% |
| Nigerians | 99.8 /100 | #77 | Exceptional 28.4% |
| Immigrants | Nepal | 99.8 /100 | #78 | Exceptional 28.4% |
| Immigrants | Iraq | 99.8 /100 | #79 | Exceptional 28.4% |
| Natives/Alaskans | 99.8 /100 | #80 | Exceptional 28.4% |
| South Americans | 99.8 /100 | #81 | Exceptional 28.4% |
| Kenyans | 99.8 /100 | #82 | Exceptional 28.4% |
| Nicaraguans | 99.8 /100 | #83 | Exceptional 28.4% |
Demographics Similar to Serbians by Family Households with Children
In terms of family households with children, the demographic groups most similar to Serbians are Immigrants from Trinidad and Tobago (26.4%, a difference of 0.010%), Paiute (26.4%, a difference of 0.030%), Immigrants from Guyana (26.3%, a difference of 0.030%), Immigrants from Bahamas (26.3%, a difference of 0.080%), and Guyanese (26.3%, a difference of 0.11%).
| Demographics | Rating | Rank | Family Households with Children |
| Macedonians | 0.1 /100 | #295 | Tragic 26.4% |
| Croatians | 0.1 /100 | #296 | Tragic 26.4% |
| Armenians | 0.1 /100 | #297 | Tragic 26.4% |
| Immigrants | Western Europe | 0.1 /100 | #298 | Tragic 26.4% |
| Trinidadians and Tobagonians | 0.1 /100 | #299 | Tragic 26.4% |
| Paiute | 0.1 /100 | #300 | Tragic 26.4% |
| Immigrants | Trinidad and Tobago | 0.1 /100 | #301 | Tragic 26.4% |
| Serbians | 0.1 /100 | #302 | Tragic 26.4% |
| Immigrants | Guyana | 0.1 /100 | #303 | Tragic 26.3% |
| Immigrants | Bahamas | 0.1 /100 | #304 | Tragic 26.3% |
| Guyanese | 0.1 /100 | #305 | Tragic 26.3% |
| Bermudans | 0.1 /100 | #306 | Tragic 26.3% |
| West Indians | 0.0 /100 | #307 | Tragic 26.3% |
| Lumbee | 0.0 /100 | #308 | Tragic 26.3% |
| Immigrants | Somalia | 0.0 /100 | #309 | Tragic 26.3% |