Scotch-Irish vs Immigrants from Nigeria Family Households with Children
COMPARE
Scotch-Irish
Immigrants from Nigeria
Family Households with Children
Family Households with Children Comparison
Scotch-Irish
Immigrants from Nigeria
26.8%
FAMILY HOUSEHOLDS WITH CHILDREN
1.4/ 100
METRIC RATING
256th/ 347
METRIC RANK
28.6%
FAMILY HOUSEHOLDS WITH CHILDREN
100.0/ 100
METRIC RATING
59th/ 347
METRIC RANK
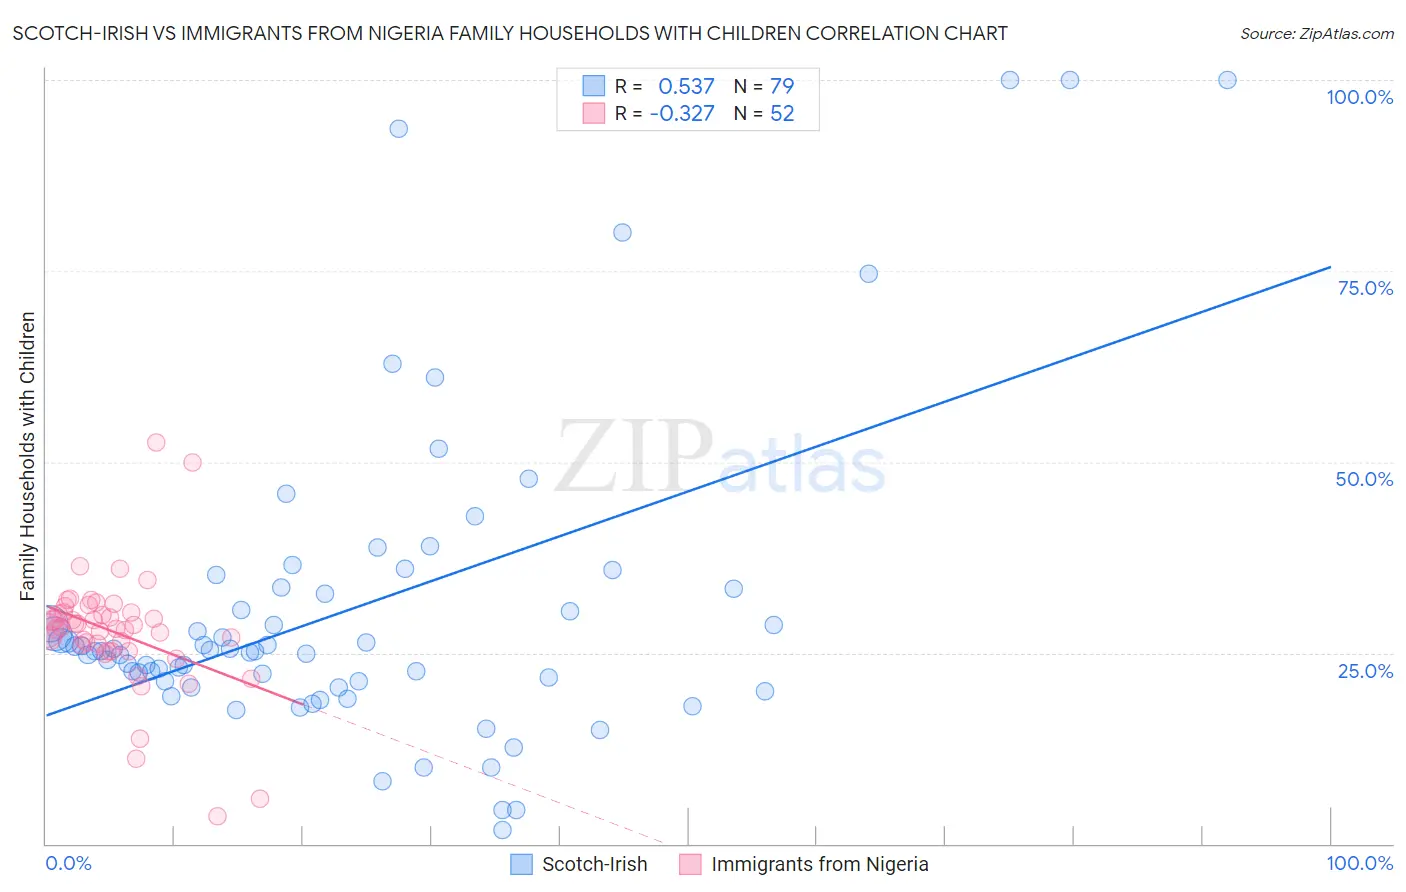
Scotch-Irish vs Immigrants from Nigeria Family Households with Children Correlation Chart
The statistical analysis conducted on geographies consisting of 548,065,437 people shows a substantial positive correlation between the proportion of Scotch-Irish and percentage of family households with children in the United States with a correlation coefficient (R) of 0.537 and weighted average of 26.8%. Similarly, the statistical analysis conducted on geographies consisting of 283,169,059 people shows a mild negative correlation between the proportion of Immigrants from Nigeria and percentage of family households with children in the United States with a correlation coefficient (R) of -0.327 and weighted average of 28.6%, a difference of 6.7%.
Family Households with Children Correlation Summary
| Measurement | Scotch-Irish | Immigrants from Nigeria |
| Minimum | 1.9% | 3.6% |
| Maximum | 100.0% | 52.5% |
| Range | 98.1% | 48.9% |
| Mean | 30.8% | 27.7% |
| Median | 25.3% | 28.2% |
| Interquartile 25% (IQ1) | 21.2% | 25.7% |
| Interquartile 75% (IQ3) | 33.3% | 30.3% |
| Interquartile Range (IQR) | 12.1% | 4.6% |
| Standard Deviation (Sample) | 20.6% | 7.9% |
| Standard Deviation (Population) | 20.5% | 7.8% |
Similar Demographics by Family Households with Children
Demographics Similar to Scotch-Irish by Family Households with Children
In terms of family households with children, the demographic groups most similar to Scotch-Irish are German Russian (26.8%, a difference of 0.010%), Immigrants from Scotland (26.8%, a difference of 0.020%), Italian (26.8%, a difference of 0.050%), Slavic (26.8%, a difference of 0.050%), and Immigrants from Cuba (26.8%, a difference of 0.050%).
| Demographics | Rating | Rank | Family Households with Children |
| Immigrants | Eastern Europe | 2.1 /100 | #249 | Tragic 26.9% |
| Belgians | 2.1 /100 | #250 | Tragic 26.9% |
| Immigrants | Bosnia and Herzegovina | 1.9 /100 | #251 | Tragic 26.8% |
| Irish | 1.8 /100 | #252 | Tragic 26.8% |
| Italians | 1.5 /100 | #253 | Tragic 26.8% |
| Immigrants | Scotland | 1.5 /100 | #254 | Tragic 26.8% |
| German Russians | 1.5 /100 | #255 | Tragic 26.8% |
| Scotch-Irish | 1.4 /100 | #256 | Tragic 26.8% |
| Slavs | 1.3 /100 | #257 | Tragic 26.8% |
| Immigrants | Cuba | 1.3 /100 | #258 | Tragic 26.8% |
| Immigrants | Lithuania | 1.2 /100 | #259 | Tragic 26.8% |
| Immigrants | Jamaica | 1.2 /100 | #260 | Tragic 26.8% |
| Immigrants | Belarus | 1.1 /100 | #261 | Tragic 26.8% |
| Immigrants | Russia | 1.0 /100 | #262 | Tragic 26.8% |
| Immigrants | North Macedonia | 1.0 /100 | #263 | Tragic 26.7% |
Demographics Similar to Immigrants from Nigeria by Family Households with Children
In terms of family households with children, the demographic groups most similar to Immigrants from Nigeria are Hmong (28.6%, a difference of 0.060%), Immigrants from Ghana (28.6%, a difference of 0.13%), Egyptian (28.6%, a difference of 0.13%), Immigrants from Lebanon (28.6%, a difference of 0.14%), and Filipino (28.6%, a difference of 0.21%).
| Demographics | Rating | Rank | Family Households with Children |
| Guatemalans | 100.0 /100 | #52 | Exceptional 28.9% |
| Immigrants | Cambodia | 100.0 /100 | #53 | Exceptional 28.9% |
| Sierra Leoneans | 100.0 /100 | #54 | Exceptional 28.9% |
| Immigrants | Asia | 100.0 /100 | #55 | Exceptional 28.8% |
| Immigrants | Guatemala | 100.0 /100 | #56 | Exceptional 28.8% |
| Danes | 100.0 /100 | #57 | Exceptional 28.7% |
| Hawaiians | 100.0 /100 | #58 | Exceptional 28.7% |
| Immigrants | Nigeria | 100.0 /100 | #59 | Exceptional 28.6% |
| Hmong | 99.9 /100 | #60 | Exceptional 28.6% |
| Immigrants | Ghana | 99.9 /100 | #61 | Exceptional 28.6% |
| Egyptians | 99.9 /100 | #62 | Exceptional 28.6% |
| Immigrants | Lebanon | 99.9 /100 | #63 | Exceptional 28.6% |
| Filipinos | 99.9 /100 | #64 | Exceptional 28.6% |
| Hondurans | 99.9 /100 | #65 | Exceptional 28.5% |
| Immigrants | Egypt | 99.9 /100 | #66 | Exceptional 28.5% |