Scotch-Irish vs Serbian Single Father Households
COMPARE
Scotch-Irish
Serbian
Single Father Households
Single Father Households Comparison
Scotch-Irish
Serbians
2.3%
SINGLE FATHER HOUSEHOLDS
69.4/ 100
METRIC RATING
165th/ 347
METRIC RANK
2.2%
SINGLE FATHER HOUSEHOLDS
96.8/ 100
METRIC RATING
129th/ 347
METRIC RANK
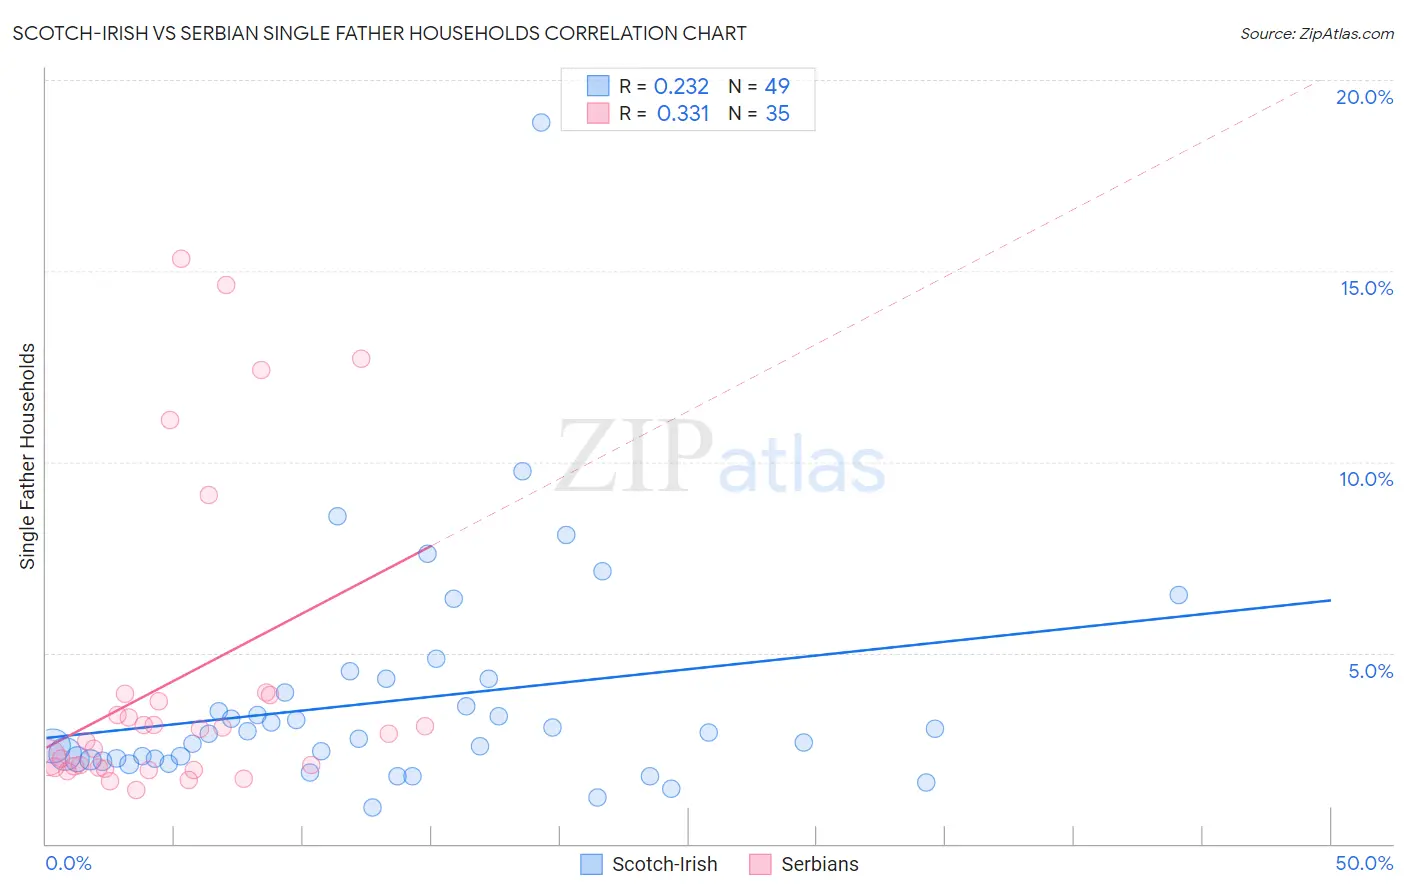
Scotch-Irish vs Serbian Single Father Households Correlation Chart
The statistical analysis conducted on geographies consisting of 535,957,408 people shows a weak positive correlation between the proportion of Scotch-Irish and percentage of single father households in the United States with a correlation coefficient (R) of 0.232 and weighted average of 2.3%. Similarly, the statistical analysis conducted on geographies consisting of 265,770,289 people shows a mild positive correlation between the proportion of Serbians and percentage of single father households in the United States with a correlation coefficient (R) of 0.331 and weighted average of 2.2%, a difference of 5.1%.
Single Father Households Correlation Summary
| Measurement | Scotch-Irish | Serbian |
| Minimum | 0.96% | 1.4% |
| Maximum | 18.9% | 15.3% |
| Range | 17.9% | 13.9% |
| Mean | 3.7% | 4.3% |
| Median | 2.9% | 2.9% |
| Interquartile 25% (IQ1) | 2.2% | 2.0% |
| Interquartile 75% (IQ3) | 4.1% | 3.9% |
| Interquartile Range (IQR) | 1.9% | 1.9% |
| Standard Deviation (Sample) | 3.0% | 4.0% |
| Standard Deviation (Population) | 3.0% | 3.9% |
Similar Demographics by Single Father Households
Demographics Similar to Scotch-Irish by Single Father Households
In terms of single father households, the demographic groups most similar to Scotch-Irish are English (2.3%, a difference of 0.070%), Pakistani (2.3%, a difference of 0.10%), Irish (2.3%, a difference of 0.24%), Scottish (2.3%, a difference of 0.31%), and Swiss (2.3%, a difference of 0.35%).
| Demographics | Rating | Rank | Single Father Households |
| Immigrants | Senegal | 79.4 /100 | #158 | Good 2.3% |
| Immigrants | West Indies | 77.9 /100 | #159 | Good 2.3% |
| Immigrants | Bolivia | 76.3 /100 | #160 | Good 2.3% |
| Swiss | 73.2 /100 | #161 | Good 2.3% |
| Scottish | 72.8 /100 | #162 | Good 2.3% |
| Irish | 72.1 /100 | #163 | Good 2.3% |
| Pakistanis | 70.6 /100 | #164 | Good 2.3% |
| Scotch-Irish | 69.4 /100 | #165 | Good 2.3% |
| English | 68.6 /100 | #166 | Good 2.3% |
| South Americans | 64.3 /100 | #167 | Good 2.3% |
| Icelanders | 63.1 /100 | #168 | Good 2.3% |
| Czechs | 62.5 /100 | #169 | Good 2.3% |
| Ugandans | 62.2 /100 | #170 | Good 2.3% |
| Swedes | 61.6 /100 | #171 | Good 2.3% |
| Czechoslovakians | 58.9 /100 | #172 | Average 2.3% |
Demographics Similar to Serbians by Single Father Households
In terms of single father households, the demographic groups most similar to Serbians are Immigrants from England (2.2%, a difference of 0.010%), Jordanian (2.2%, a difference of 0.050%), Moroccan (2.2%, a difference of 0.060%), Immigrants from Chile (2.2%, a difference of 0.11%), and Immigrants from Jordan (2.2%, a difference of 0.17%).
| Demographics | Rating | Rank | Single Father Households |
| Immigrants | Iraq | 97.6 /100 | #122 | Exceptional 2.2% |
| Immigrants | Yemen | 97.5 /100 | #123 | Exceptional 2.2% |
| British West Indians | 97.4 /100 | #124 | Exceptional 2.2% |
| Immigrants | Indonesia | 97.4 /100 | #125 | Exceptional 2.2% |
| Moroccans | 96.9 /100 | #126 | Exceptional 2.2% |
| Jordanians | 96.9 /100 | #127 | Exceptional 2.2% |
| Immigrants | England | 96.8 /100 | #128 | Exceptional 2.2% |
| Serbians | 96.8 /100 | #129 | Exceptional 2.2% |
| Immigrants | Chile | 96.7 /100 | #130 | Exceptional 2.2% |
| Immigrants | Jordan | 96.6 /100 | #131 | Exceptional 2.2% |
| Poles | 96.5 /100 | #132 | Exceptional 2.2% |
| Taiwanese | 96.3 /100 | #133 | Exceptional 2.2% |
| Zimbabweans | 95.1 /100 | #134 | Exceptional 2.2% |
| Syrians | 94.8 /100 | #135 | Exceptional 2.2% |
| Chileans | 94.5 /100 | #136 | Exceptional 2.2% |