Ottawa vs Serbian Family Households with Children
COMPARE
Ottawa
Serbian
Family Households with Children
Family Households with Children Comparison
Ottawa
Serbians
26.1%
FAMILY HOUSEHOLDS WITH CHILDREN
0.0/ 100
METRIC RATING
317th/ 347
METRIC RANK
26.4%
FAMILY HOUSEHOLDS WITH CHILDREN
0.1/ 100
METRIC RATING
302nd/ 347
METRIC RANK
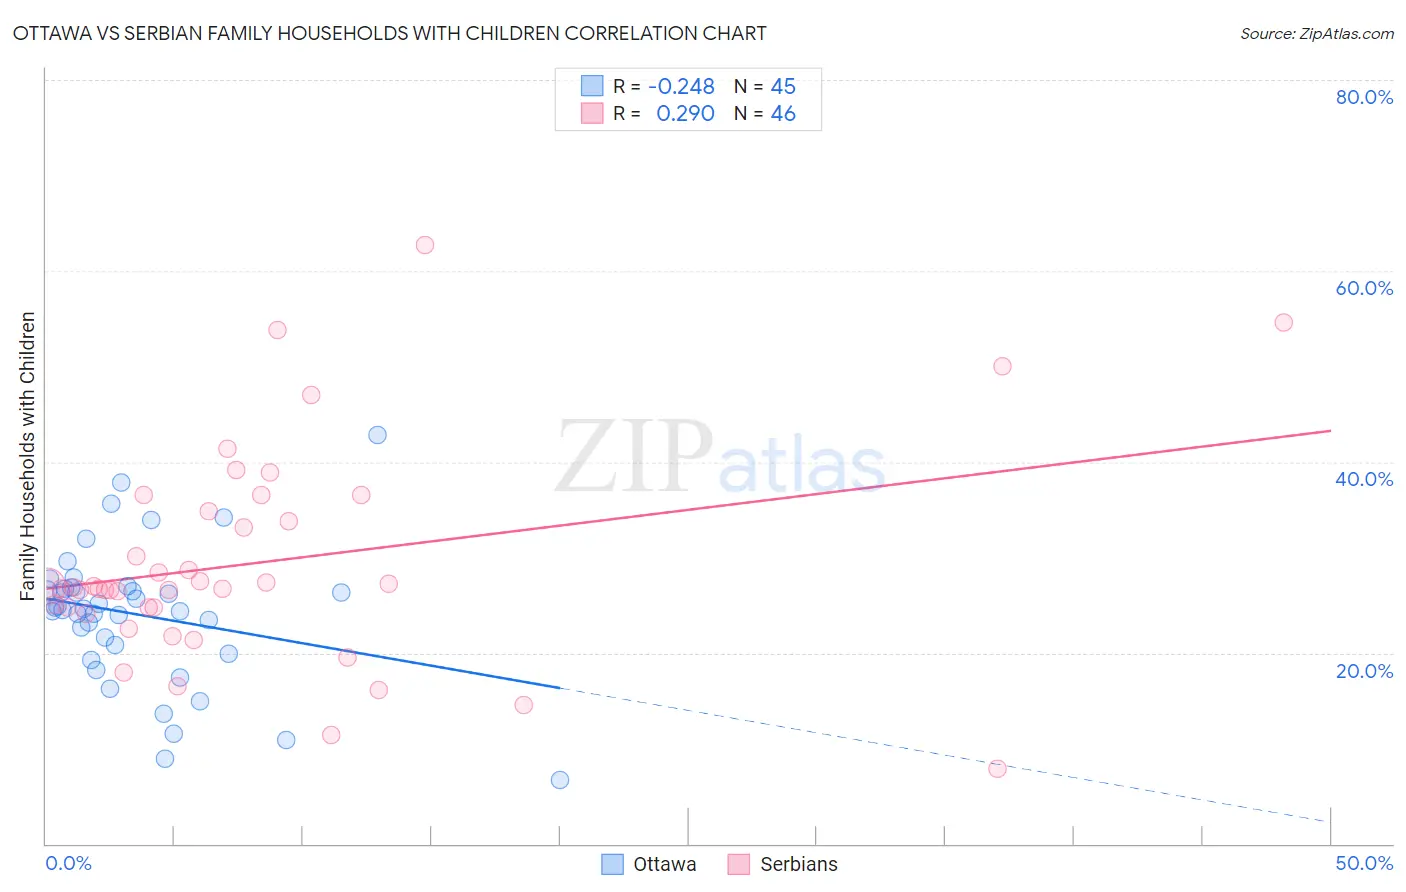
Ottawa vs Serbian Family Households with Children Correlation Chart
The statistical analysis conducted on geographies consisting of 49,929,923 people shows a weak negative correlation between the proportion of Ottawa and percentage of family households with children in the United States with a correlation coefficient (R) of -0.248 and weighted average of 26.1%. Similarly, the statistical analysis conducted on geographies consisting of 267,409,875 people shows a weak positive correlation between the proportion of Serbians and percentage of family households with children in the United States with a correlation coefficient (R) of 0.290 and weighted average of 26.4%, a difference of 1.1%.
Family Households with Children Correlation Summary
| Measurement | Ottawa | Serbian |
| Minimum | 6.7% | 7.8% |
| Maximum | 42.9% | 62.7% |
| Range | 36.2% | 54.8% |
| Mean | 24.0% | 29.5% |
| Median | 24.6% | 26.8% |
| Interquartile 25% (IQ1) | 20.4% | 24.7% |
| Interquartile 75% (IQ3) | 26.8% | 34.8% |
| Interquartile Range (IQR) | 6.4% | 10.1% |
| Standard Deviation (Sample) | 7.3% | 11.1% |
| Standard Deviation (Population) | 7.2% | 11.0% |
Demographics Similar to Ottawa and Serbians by Family Households with Children
In terms of family households with children, the demographic groups most similar to Ottawa are Iroquois (26.1%, a difference of 0.050%), Estonian (26.1%, a difference of 0.090%), Immigrants from France (26.0%, a difference of 0.14%), Immigrants from Norway (26.1%, a difference of 0.17%), and French Canadian (26.1%, a difference of 0.24%). Similarly, the demographic groups most similar to Serbians are Immigrants from Trinidad and Tobago (26.4%, a difference of 0.010%), Paiute (26.4%, a difference of 0.030%), Immigrants from Guyana (26.3%, a difference of 0.030%), Immigrants from Bahamas (26.3%, a difference of 0.080%), and Guyanese (26.3%, a difference of 0.11%).
| Demographics | Rating | Rank | Family Households with Children |
| Trinidadians and Tobagonians | 0.1 /100 | #299 | Tragic 26.4% |
| Paiute | 0.1 /100 | #300 | Tragic 26.4% |
| Immigrants | Trinidad and Tobago | 0.1 /100 | #301 | Tragic 26.4% |
| Serbians | 0.1 /100 | #302 | Tragic 26.4% |
| Immigrants | Guyana | 0.1 /100 | #303 | Tragic 26.3% |
| Immigrants | Bahamas | 0.1 /100 | #304 | Tragic 26.3% |
| Guyanese | 0.1 /100 | #305 | Tragic 26.3% |
| Bermudans | 0.1 /100 | #306 | Tragic 26.3% |
| West Indians | 0.0 /100 | #307 | Tragic 26.3% |
| Lumbee | 0.0 /100 | #308 | Tragic 26.3% |
| Immigrants | Somalia | 0.0 /100 | #309 | Tragic 26.3% |
| Marshallese | 0.0 /100 | #310 | Tragic 26.2% |
| Colville | 0.0 /100 | #311 | Tragic 26.2% |
| Immigrants | Czechoslovakia | 0.0 /100 | #312 | Tragic 26.2% |
| Cree | 0.0 /100 | #313 | Tragic 26.2% |
| French Canadians | 0.0 /100 | #314 | Tragic 26.1% |
| Immigrants | Norway | 0.0 /100 | #315 | Tragic 26.1% |
| Estonians | 0.0 /100 | #316 | Tragic 26.1% |
| Ottawa | 0.0 /100 | #317 | Tragic 26.1% |
| Iroquois | 0.0 /100 | #318 | Tragic 26.1% |
| Immigrants | France | 0.0 /100 | #319 | Tragic 26.0% |