Scotch-Irish vs Immigrants from Guyana Family Households
COMPARE
Scotch-Irish
Immigrants from Guyana
Family Households
Family Households Comparison
Scotch-Irish
Immigrants from Guyana
64.4%
FAMILY HOUSEHOLDS
59.2/ 100
METRIC RATING
166th/ 347
METRIC RANK
65.5%
FAMILY HOUSEHOLDS
99.6/ 100
METRIC RATING
83rd/ 347
METRIC RANK
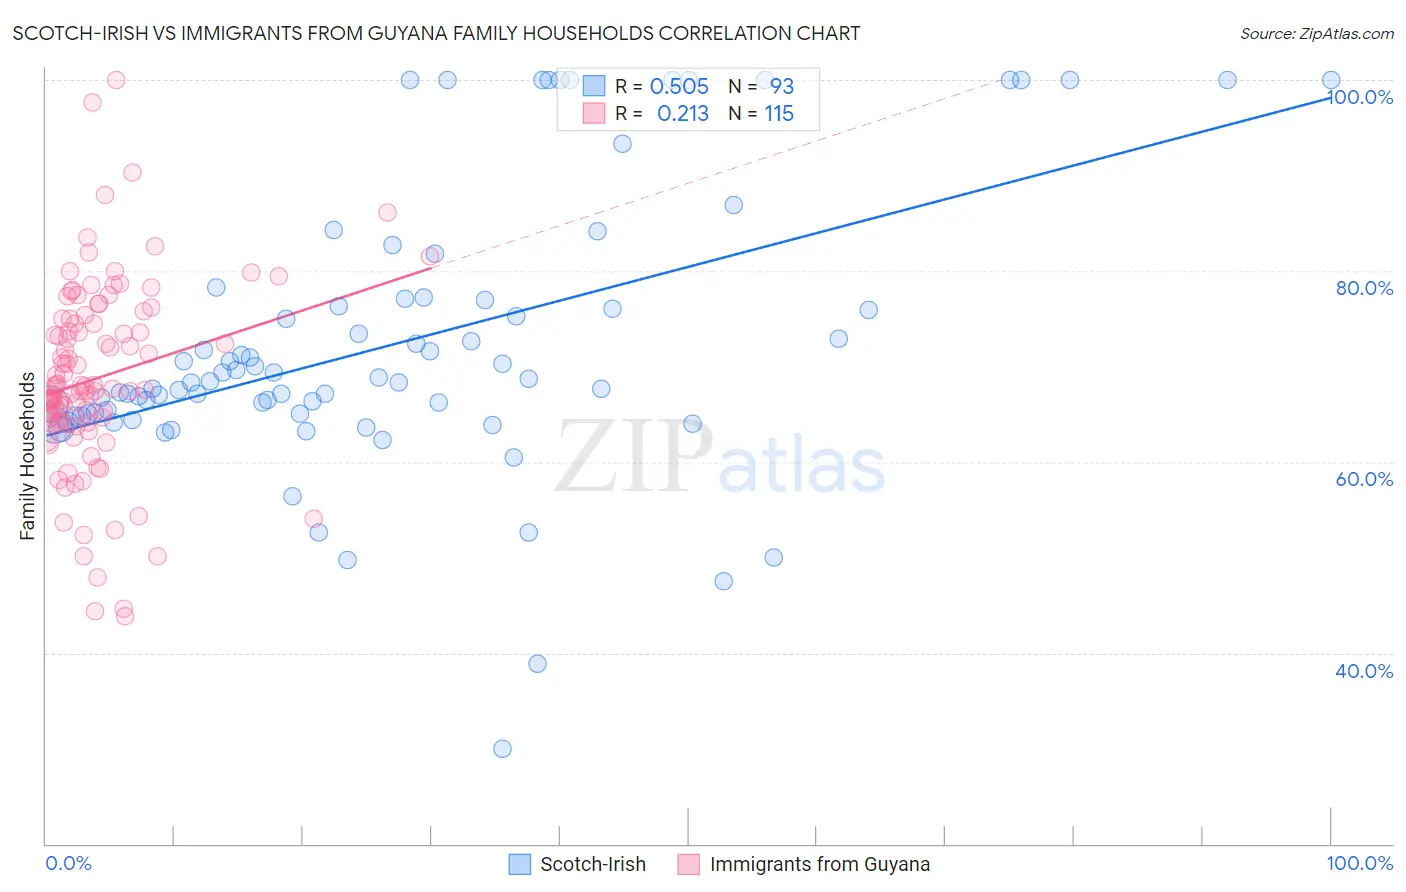
Scotch-Irish vs Immigrants from Guyana Family Households Correlation Chart
The statistical analysis conducted on geographies consisting of 548,372,963 people shows a substantial positive correlation between the proportion of Scotch-Irish and percentage of family households in the United States with a correlation coefficient (R) of 0.505 and weighted average of 64.4%. Similarly, the statistical analysis conducted on geographies consisting of 183,692,890 people shows a weak positive correlation between the proportion of Immigrants from Guyana and percentage of family households in the United States with a correlation coefficient (R) of 0.213 and weighted average of 65.5%, a difference of 1.8%.
Family Households Correlation Summary
| Measurement | Scotch-Irish | Immigrants from Guyana |
| Minimum | 29.9% | 43.8% |
| Maximum | 100.0% | 100.0% |
| Range | 70.1% | 56.2% |
| Mean | 72.5% | 68.8% |
| Median | 68.4% | 67.6% |
| Interquartile 25% (IQ1) | 64.9% | 64.1% |
| Interquartile 75% (IQ3) | 77.0% | 74.9% |
| Interquartile Range (IQR) | 12.1% | 10.8% |
| Standard Deviation (Sample) | 14.6% | 9.8% |
| Standard Deviation (Population) | 14.5% | 9.8% |
Similar Demographics by Family Households
Demographics Similar to Scotch-Irish by Family Households
In terms of family households, the demographic groups most similar to Scotch-Irish are Immigrants from Nigeria (64.4%, a difference of 0.010%), Immigrants from Southern Europe (64.4%, a difference of 0.010%), Irish (64.4%, a difference of 0.020%), Honduran (64.4%, a difference of 0.020%), and British (64.4%, a difference of 0.030%).
| Demographics | Rating | Rank | Family Households |
| Germans | 65.8 /100 | #159 | Good 64.4% |
| Immigrants | Moldova | 65.2 /100 | #160 | Good 64.4% |
| Immigrants | England | 62.6 /100 | #161 | Good 64.4% |
| British | 61.6 /100 | #162 | Good 64.4% |
| Chickasaw | 61.5 /100 | #163 | Good 64.4% |
| Immigrants | Nigeria | 60.1 /100 | #164 | Good 64.4% |
| Immigrants | Southern Europe | 60.0 /100 | #165 | Good 64.4% |
| Scotch-Irish | 59.2 /100 | #166 | Average 64.4% |
| Irish | 57.9 /100 | #167 | Average 64.4% |
| Hondurans | 57.5 /100 | #168 | Average 64.4% |
| Iraqis | 56.0 /100 | #169 | Average 64.4% |
| Armenians | 55.9 /100 | #170 | Average 64.4% |
| Ute | 54.6 /100 | #171 | Average 64.3% |
| Dutch West Indians | 53.9 /100 | #172 | Average 64.3% |
| Immigrants | Sierra Leone | 52.5 /100 | #173 | Average 64.3% |
Demographics Similar to Immigrants from Guyana by Family Households
In terms of family households, the demographic groups most similar to Immigrants from Guyana are Immigrants from Lebanon (65.5%, a difference of 0.010%), American (65.5%, a difference of 0.020%), Jordanian (65.5%, a difference of 0.040%), Puget Sound Salish (65.6%, a difference of 0.13%), and Immigrants from Cambodia (65.4%, a difference of 0.13%).
| Demographics | Rating | Rank | Family Households |
| Immigrants | Azores | 99.8 /100 | #76 | Exceptional 65.6% |
| Immigrants | South America | 99.8 /100 | #77 | Exceptional 65.6% |
| Yaqui | 99.8 /100 | #78 | Exceptional 65.6% |
| Immigrants | Costa Rica | 99.8 /100 | #79 | Exceptional 65.6% |
| Puget Sound Salish | 99.8 /100 | #80 | Exceptional 65.6% |
| Jordanians | 99.7 /100 | #81 | Exceptional 65.5% |
| Immigrants | Lebanon | 99.7 /100 | #82 | Exceptional 65.5% |
| Immigrants | Guyana | 99.6 /100 | #83 | Exceptional 65.5% |
| Americans | 99.6 /100 | #84 | Exceptional 65.5% |
| Immigrants | Cambodia | 99.5 /100 | #85 | Exceptional 65.4% |
| Egyptians | 99.4 /100 | #86 | Exceptional 65.4% |
| Immigrants | Egypt | 99.2 /100 | #87 | Exceptional 65.3% |
| Immigrants | Haiti | 99.1 /100 | #88 | Exceptional 65.3% |
| Immigrants | Caribbean | 99.1 /100 | #89 | Exceptional 65.3% |
| Immigrants | Laos | 99.1 /100 | #90 | Exceptional 65.3% |