Ute vs Macedonian Family Households
COMPARE
Ute
Macedonian
Family Households
Family Households Comparison
Ute
Macedonians
64.3%
FAMILY HOUSEHOLDS
54.6/ 100
METRIC RATING
171st/ 347
METRIC RANK
63.7%
FAMILY HOUSEHOLDS
6.5/ 100
METRIC RATING
219th/ 347
METRIC RANK
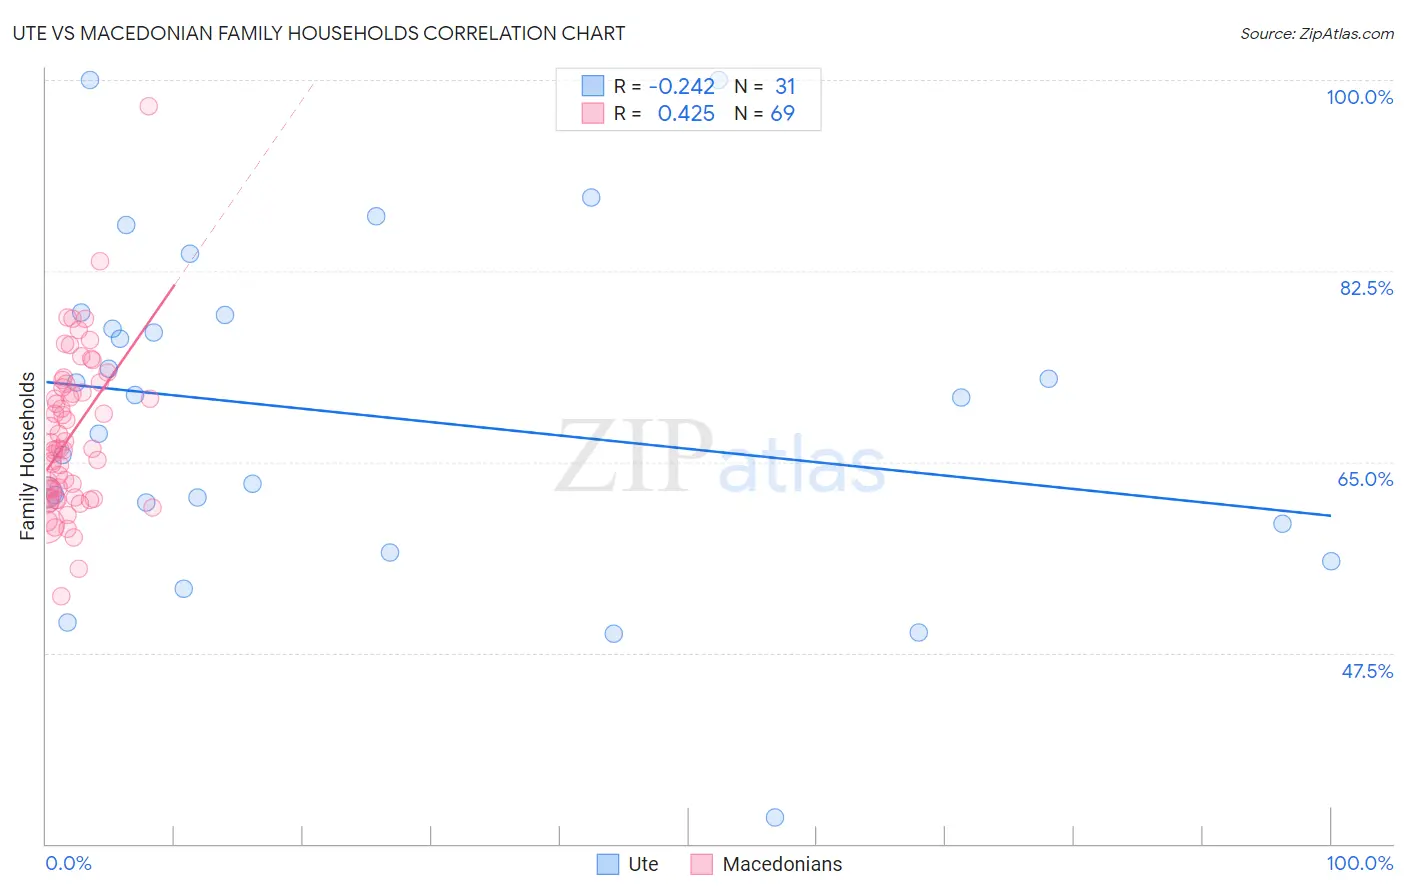
Ute vs Macedonian Family Households Correlation Chart
The statistical analysis conducted on geographies consisting of 55,658,478 people shows a weak negative correlation between the proportion of Ute and percentage of family households in the United States with a correlation coefficient (R) of -0.242 and weighted average of 64.3%. Similarly, the statistical analysis conducted on geographies consisting of 132,622,141 people shows a moderate positive correlation between the proportion of Macedonians and percentage of family households in the United States with a correlation coefficient (R) of 0.425 and weighted average of 63.7%, a difference of 0.97%.
Family Households Correlation Summary
| Measurement | Ute | Macedonian |
| Minimum | 32.4% | 52.7% |
| Maximum | 100.0% | 97.6% |
| Range | 67.6% | 44.8% |
| Mean | 69.2% | 67.5% |
| Median | 70.9% | 66.2% |
| Interquartile 25% (IQ1) | 59.4% | 61.7% |
| Interquartile 75% (IQ3) | 78.5% | 72.0% |
| Interquartile Range (IQR) | 19.1% | 10.2% |
| Standard Deviation (Sample) | 15.3% | 7.2% |
| Standard Deviation (Population) | 15.0% | 7.2% |
Similar Demographics by Family Households
Demographics Similar to Ute by Family Households
In terms of family households, the demographic groups most similar to Ute are Dutch West Indian (64.3%, a difference of 0.010%), Iraqi (64.4%, a difference of 0.020%), Armenian (64.4%, a difference of 0.020%), Immigrants from Sierra Leone (64.3%, a difference of 0.030%), and Irish (64.4%, a difference of 0.040%).
| Demographics | Rating | Rank | Family Households |
| Immigrants | Nigeria | 60.1 /100 | #164 | Good 64.4% |
| Immigrants | Southern Europe | 60.0 /100 | #165 | Good 64.4% |
| Scotch-Irish | 59.2 /100 | #166 | Average 64.4% |
| Irish | 57.9 /100 | #167 | Average 64.4% |
| Hondurans | 57.5 /100 | #168 | Average 64.4% |
| Iraqis | 56.0 /100 | #169 | Average 64.4% |
| Armenians | 55.9 /100 | #170 | Average 64.4% |
| Ute | 54.6 /100 | #171 | Average 64.3% |
| Dutch West Indians | 53.9 /100 | #172 | Average 64.3% |
| Immigrants | Sierra Leone | 52.5 /100 | #173 | Average 64.3% |
| Immigrants | Germany | 50.0 /100 | #174 | Average 64.3% |
| Bangladeshis | 44.3 /100 | #175 | Average 64.3% |
| Vietnamese | 43.6 /100 | #176 | Average 64.2% |
| Immigrants | Micronesia | 42.3 /100 | #177 | Average 64.2% |
| Jamaicans | 40.6 /100 | #178 | Average 64.2% |
Demographics Similar to Macedonians by Family Households
In terms of family households, the demographic groups most similar to Macedonians are Immigrants from Europe (63.7%, a difference of 0.010%), Osage (63.7%, a difference of 0.030%), Marshallese (63.7%, a difference of 0.030%), Immigrants from South Africa (63.7%, a difference of 0.030%), and Croatian (63.8%, a difference of 0.040%).
| Demographics | Rating | Rank | Family Households |
| Immigrants | Netherlands | 9.4 /100 | #212 | Tragic 63.8% |
| Immigrants | Northern Europe | 8.8 /100 | #213 | Tragic 63.8% |
| Celtics | 8.0 /100 | #214 | Tragic 63.8% |
| Belgians | 7.6 /100 | #215 | Tragic 63.8% |
| Croatians | 7.3 /100 | #216 | Tragic 63.8% |
| Osage | 7.0 /100 | #217 | Tragic 63.7% |
| Marshallese | 6.9 /100 | #218 | Tragic 63.7% |
| Macedonians | 6.5 /100 | #219 | Tragic 63.7% |
| Immigrants | Europe | 6.4 /100 | #220 | Tragic 63.7% |
| Immigrants | South Africa | 5.9 /100 | #221 | Tragic 63.7% |
| Immigrants | Belarus | 5.5 /100 | #222 | Tragic 63.7% |
| French Canadians | 5.4 /100 | #223 | Tragic 63.7% |
| Turks | 4.5 /100 | #224 | Tragic 63.6% |
| Immigrants | Hungary | 4.3 /100 | #225 | Tragic 63.6% |
| Immigrants | Bahamas | 4.2 /100 | #226 | Tragic 63.6% |