Immigrants from Uruguay vs Macedonian Family Households
COMPARE
Immigrants from Uruguay
Macedonian
Family Households
Family Households Comparison
Immigrants from Uruguay
Macedonians
63.9%
FAMILY HOUSEHOLDS
12.8/ 100
METRIC RATING
204th/ 347
METRIC RANK
63.7%
FAMILY HOUSEHOLDS
6.5/ 100
METRIC RATING
219th/ 347
METRIC RANK
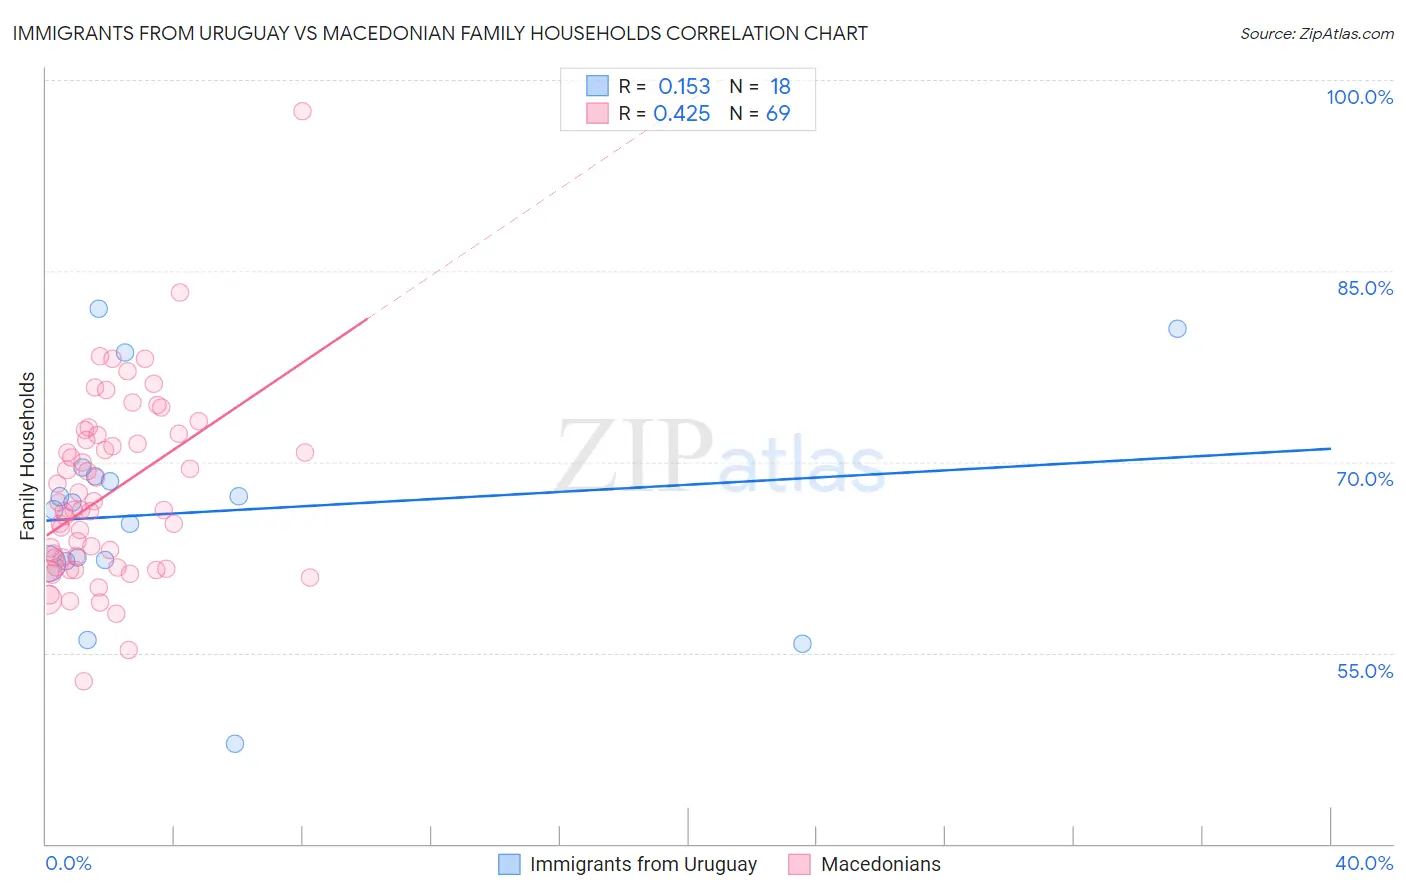
Immigrants from Uruguay vs Macedonian Family Households Correlation Chart
The statistical analysis conducted on geographies consisting of 133,245,142 people shows a poor positive correlation between the proportion of Immigrants from Uruguay and percentage of family households in the United States with a correlation coefficient (R) of 0.153 and weighted average of 63.9%. Similarly, the statistical analysis conducted on geographies consisting of 132,622,141 people shows a moderate positive correlation between the proportion of Macedonians and percentage of family households in the United States with a correlation coefficient (R) of 0.425 and weighted average of 63.7%, a difference of 0.26%.
Family Households Correlation Summary
| Measurement | Immigrants from Uruguay | Macedonian |
| Minimum | 47.9% | 52.7% |
| Maximum | 82.0% | 97.6% |
| Range | 34.1% | 44.8% |
| Mean | 66.1% | 67.5% |
| Median | 66.5% | 66.2% |
| Interquartile 25% (IQ1) | 62.2% | 61.7% |
| Interquartile 75% (IQ3) | 68.9% | 72.0% |
| Interquartile Range (IQR) | 6.7% | 10.2% |
| Standard Deviation (Sample) | 8.6% | 7.2% |
| Standard Deviation (Population) | 8.3% | 7.2% |
Demographics Similar to Immigrants from Uruguay and Macedonians by Family Households
In terms of family households, the demographic groups most similar to Immigrants from Uruguay are Norwegian (63.9%, a difference of 0.010%), Brazilian (63.9%, a difference of 0.010%), Iranian (63.9%, a difference of 0.020%), Immigrants from Lithuania (63.9%, a difference of 0.020%), and Nigerian (63.9%, a difference of 0.040%). Similarly, the demographic groups most similar to Macedonians are Immigrants from Europe (63.7%, a difference of 0.010%), Osage (63.7%, a difference of 0.030%), Marshallese (63.7%, a difference of 0.030%), Immigrants from South Africa (63.7%, a difference of 0.030%), and Croatian (63.8%, a difference of 0.040%).
| Demographics | Rating | Rank | Family Households |
| Immigrants | Eastern Europe | 17.2 /100 | #201 | Poor 64.0% |
| Iranians | 13.5 /100 | #202 | Poor 63.9% |
| Norwegians | 13.2 /100 | #203 | Poor 63.9% |
| Immigrants | Uruguay | 12.8 /100 | #204 | Poor 63.9% |
| Brazilians | 12.4 /100 | #205 | Poor 63.9% |
| Immigrants | Lithuania | 12.1 /100 | #206 | Poor 63.9% |
| Nigerians | 11.5 /100 | #207 | Poor 63.9% |
| Immigrants | Bangladesh | 11.4 /100 | #208 | Poor 63.9% |
| Sierra Leoneans | 11.2 /100 | #209 | Poor 63.9% |
| Immigrants | Thailand | 9.6 /100 | #210 | Tragic 63.8% |
| Shoshone | 9.4 /100 | #211 | Tragic 63.8% |
| Immigrants | Netherlands | 9.4 /100 | #212 | Tragic 63.8% |
| Immigrants | Northern Europe | 8.8 /100 | #213 | Tragic 63.8% |
| Celtics | 8.0 /100 | #214 | Tragic 63.8% |
| Belgians | 7.6 /100 | #215 | Tragic 63.8% |
| Croatians | 7.3 /100 | #216 | Tragic 63.8% |
| Osage | 7.0 /100 | #217 | Tragic 63.7% |
| Marshallese | 6.9 /100 | #218 | Tragic 63.7% |
| Macedonians | 6.5 /100 | #219 | Tragic 63.7% |
| Immigrants | Europe | 6.4 /100 | #220 | Tragic 63.7% |
| Immigrants | South Africa | 5.9 /100 | #221 | Tragic 63.7% |