Somali vs Macedonian Family Households
COMPARE
Somali
Macedonian
Family Households
Family Households Comparison
Somalis
Macedonians
57.6%
FAMILY HOUSEHOLDS
0.0/ 100
METRIC RATING
346th/ 347
METRIC RANK
63.7%
FAMILY HOUSEHOLDS
6.5/ 100
METRIC RATING
219th/ 347
METRIC RANK
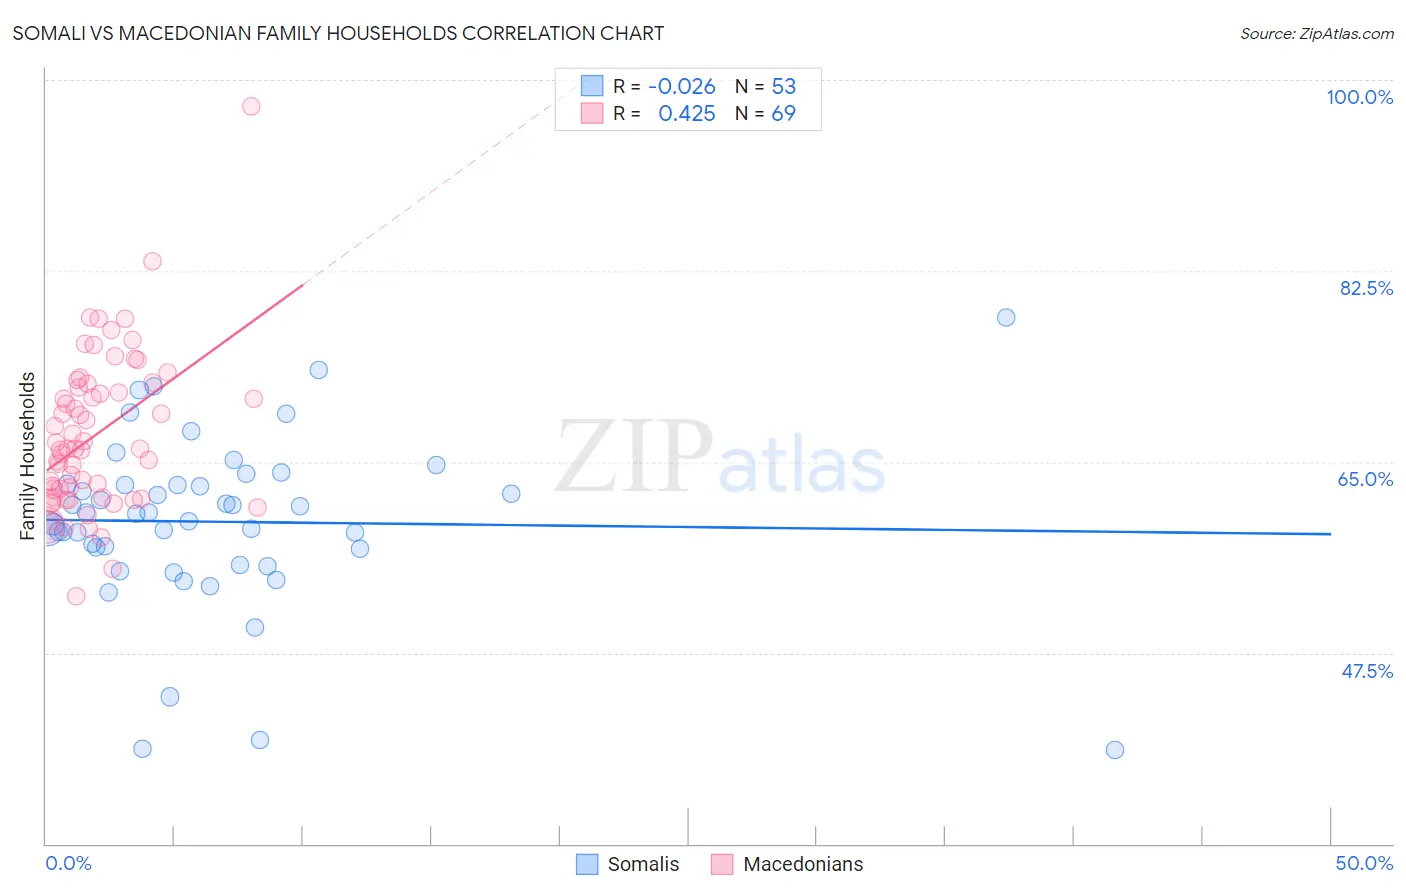
Somali vs Macedonian Family Households Correlation Chart
The statistical analysis conducted on geographies consisting of 99,263,237 people shows no correlation between the proportion of Somalis and percentage of family households in the United States with a correlation coefficient (R) of -0.026 and weighted average of 57.6%. Similarly, the statistical analysis conducted on geographies consisting of 132,622,141 people shows a moderate positive correlation between the proportion of Macedonians and percentage of family households in the United States with a correlation coefficient (R) of 0.425 and weighted average of 63.7%, a difference of 10.5%.
Family Households Correlation Summary
| Measurement | Somali | Macedonian |
| Minimum | 38.6% | 52.7% |
| Maximum | 78.2% | 97.6% |
| Range | 39.6% | 44.8% |
| Mean | 59.5% | 67.5% |
| Median | 60.2% | 66.2% |
| Interquartile 25% (IQ1) | 56.3% | 61.7% |
| Interquartile 75% (IQ3) | 62.9% | 72.0% |
| Interquartile Range (IQR) | 6.6% | 10.2% |
| Standard Deviation (Sample) | 7.8% | 7.2% |
| Standard Deviation (Population) | 7.8% | 7.2% |
Similar Demographics by Family Households
Demographics Similar to Somalis by Family Households
In terms of family households, the demographic groups most similar to Somalis are Immigrants from Somalia (56.7%, a difference of 1.7%), Immigrants from Zaire (59.2%, a difference of 2.6%), Immigrants from Congo (59.2%, a difference of 2.8%), Senegalese (59.8%, a difference of 3.8%), and Sudanese (60.0%, a difference of 4.1%).
| Demographics | Rating | Rank | Family Households |
| Immigrants | Ethiopia | 0.0 /100 | #333 | Tragic 61.2% |
| Immigrants | Eastern Africa | 0.0 /100 | #334 | Tragic 61.1% |
| Carpatho Rusyns | 0.0 /100 | #335 | Tragic 61.1% |
| German Russians | 0.0 /100 | #336 | Tragic 60.9% |
| Soviet Union | 0.0 /100 | #337 | Tragic 60.9% |
| Immigrants | Eritrea | 0.0 /100 | #338 | Tragic 60.8% |
| Immigrants | Saudi Arabia | 0.0 /100 | #339 | Tragic 60.7% |
| Immigrants | Sudan | 0.0 /100 | #340 | Tragic 60.2% |
| Immigrants | Senegal | 0.0 /100 | #341 | Tragic 60.1% |
| Sudanese | 0.0 /100 | #342 | Tragic 60.0% |
| Senegalese | 0.0 /100 | #343 | Tragic 59.8% |
| Immigrants | Congo | 0.0 /100 | #344 | Tragic 59.2% |
| Immigrants | Zaire | 0.0 /100 | #345 | Tragic 59.2% |
| Somalis | 0.0 /100 | #346 | Tragic 57.6% |
| Immigrants | Somalia | 0.0 /100 | #347 | Tragic 56.7% |
Demographics Similar to Macedonians by Family Households
In terms of family households, the demographic groups most similar to Macedonians are Immigrants from Europe (63.7%, a difference of 0.010%), Osage (63.7%, a difference of 0.030%), Marshallese (63.7%, a difference of 0.030%), Immigrants from South Africa (63.7%, a difference of 0.030%), and Croatian (63.8%, a difference of 0.040%).
| Demographics | Rating | Rank | Family Households |
| Immigrants | Netherlands | 9.4 /100 | #212 | Tragic 63.8% |
| Immigrants | Northern Europe | 8.8 /100 | #213 | Tragic 63.8% |
| Celtics | 8.0 /100 | #214 | Tragic 63.8% |
| Belgians | 7.6 /100 | #215 | Tragic 63.8% |
| Croatians | 7.3 /100 | #216 | Tragic 63.8% |
| Osage | 7.0 /100 | #217 | Tragic 63.7% |
| Marshallese | 6.9 /100 | #218 | Tragic 63.7% |
| Macedonians | 6.5 /100 | #219 | Tragic 63.7% |
| Immigrants | Europe | 6.4 /100 | #220 | Tragic 63.7% |
| Immigrants | South Africa | 5.9 /100 | #221 | Tragic 63.7% |
| Immigrants | Belarus | 5.5 /100 | #222 | Tragic 63.7% |
| French Canadians | 5.4 /100 | #223 | Tragic 63.7% |
| Turks | 4.5 /100 | #224 | Tragic 63.6% |
| Immigrants | Hungary | 4.3 /100 | #225 | Tragic 63.6% |
| Immigrants | Bahamas | 4.2 /100 | #226 | Tragic 63.6% |