Swiss vs Immigrants from Uganda Family Households
COMPARE
Swiss
Immigrants from Uganda
Family Households
Family Households Comparison
Swiss
Immigrants from Uganda
65.2%
FAMILY HOUSEHOLDS
98.6/ 100
METRIC RATING
96th/ 347
METRIC RANK
62.7%
FAMILY HOUSEHOLDS
0.1/ 100
METRIC RATING
288th/ 347
METRIC RANK
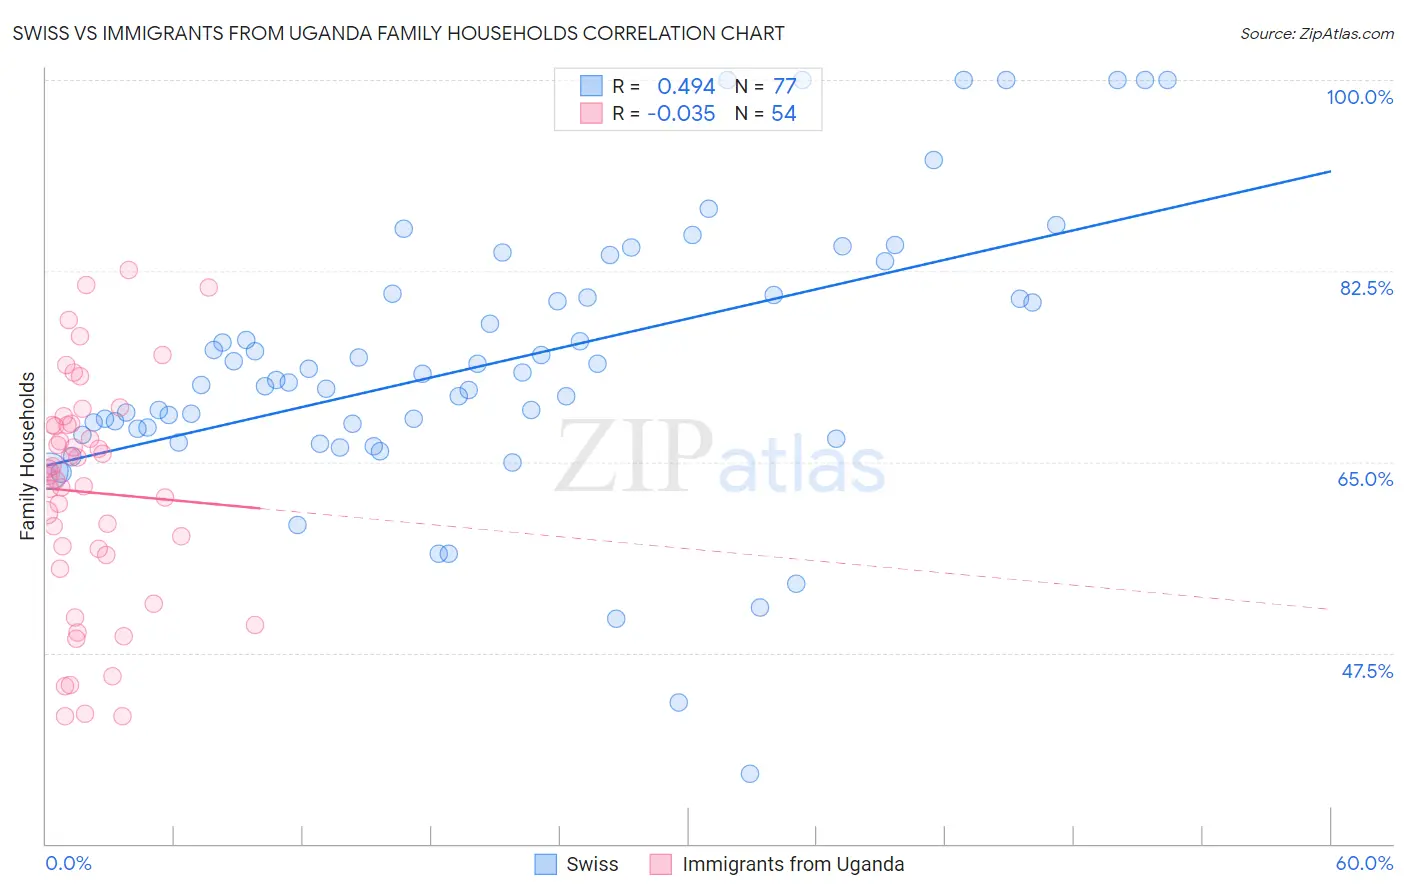
Swiss vs Immigrants from Uganda Family Households Correlation Chart
The statistical analysis conducted on geographies consisting of 464,763,466 people shows a moderate positive correlation between the proportion of Swiss and percentage of family households in the United States with a correlation coefficient (R) of 0.494 and weighted average of 65.2%. Similarly, the statistical analysis conducted on geographies consisting of 125,974,849 people shows no correlation between the proportion of Immigrants from Uganda and percentage of family households in the United States with a correlation coefficient (R) of -0.035 and weighted average of 62.7%, a difference of 3.9%.
Family Households Correlation Summary
| Measurement | Swiss | Immigrants from Uganda |
| Minimum | 36.4% | 41.7% |
| Maximum | 100.0% | 82.6% |
| Range | 63.6% | 40.9% |
| Mean | 74.1% | 62.2% |
| Median | 72.5% | 63.9% |
| Interquartile 25% (IQ1) | 67.7% | 56.5% |
| Interquartile 75% (IQ3) | 80.3% | 68.3% |
| Interquartile Range (IQR) | 12.6% | 11.9% |
| Standard Deviation (Sample) | 12.7% | 10.5% |
| Standard Deviation (Population) | 12.7% | 10.4% |
Similar Demographics by Family Households
Demographics Similar to Swiss by Family Households
In terms of family households, the demographic groups most similar to Swiss are Guatemalan (65.2%, a difference of 0.0%), Immigrants from Portugal (65.2%, a difference of 0.010%), Immigrants from Poland (65.2%, a difference of 0.030%), Immigrants from Syria (65.2%, a difference of 0.040%), and Hopi (65.3%, a difference of 0.050%).
| Demographics | Rating | Rank | Family Households |
| Immigrants | Caribbean | 99.1 /100 | #89 | Exceptional 65.3% |
| Immigrants | Laos | 99.1 /100 | #90 | Exceptional 65.3% |
| Crow | 98.9 /100 | #91 | Exceptional 65.3% |
| Hopi | 98.8 /100 | #92 | Exceptional 65.3% |
| Guyanese | 98.8 /100 | #93 | Exceptional 65.3% |
| Immigrants | Poland | 98.7 /100 | #94 | Exceptional 65.2% |
| Immigrants | Portugal | 98.6 /100 | #95 | Exceptional 65.2% |
| Swiss | 98.6 /100 | #96 | Exceptional 65.2% |
| Guatemalans | 98.6 /100 | #97 | Exceptional 65.2% |
| Immigrants | Syria | 98.4 /100 | #98 | Exceptional 65.2% |
| Central American Indians | 98.3 /100 | #99 | Exceptional 65.2% |
| Haitians | 98.1 /100 | #100 | Exceptional 65.2% |
| Chileans | 98.1 /100 | #101 | Exceptional 65.2% |
| Immigrants | Sri Lanka | 98.0 /100 | #102 | Exceptional 65.1% |
| Indians (Asian) | 97.9 /100 | #103 | Exceptional 65.1% |
Demographics Similar to Immigrants from Uganda by Family Households
In terms of family households, the demographic groups most similar to Immigrants from Uganda are British West Indian (62.8%, a difference of 0.020%), Latvian (62.8%, a difference of 0.020%), Mongolian (62.8%, a difference of 0.050%), Immigrants from Nepal (62.7%, a difference of 0.090%), and Australian (62.8%, a difference of 0.16%).
| Demographics | Rating | Rank | Family Households |
| Estonians | 0.2 /100 | #281 | Tragic 62.9% |
| New Zealanders | 0.1 /100 | #282 | Tragic 62.9% |
| Immigrants | Denmark | 0.1 /100 | #283 | Tragic 62.9% |
| Australians | 0.1 /100 | #284 | Tragic 62.8% |
| Mongolians | 0.1 /100 | #285 | Tragic 62.8% |
| British West Indians | 0.1 /100 | #286 | Tragic 62.8% |
| Latvians | 0.1 /100 | #287 | Tragic 62.8% |
| Immigrants | Uganda | 0.1 /100 | #288 | Tragic 62.7% |
| Immigrants | Nepal | 0.1 /100 | #289 | Tragic 62.7% |
| Immigrants | Grenada | 0.0 /100 | #290 | Tragic 62.6% |
| U.S. Virgin Islanders | 0.0 /100 | #291 | Tragic 62.6% |
| Immigrants | Burma/Myanmar | 0.0 /100 | #292 | Tragic 62.6% |
| Immigrants | Sweden | 0.0 /100 | #293 | Tragic 62.5% |
| Barbadians | 0.0 /100 | #294 | Tragic 62.5% |
| Okinawans | 0.0 /100 | #295 | Tragic 62.5% |