Scandinavian vs Immigrants from Ukraine Divorced or Separated
COMPARE
Scandinavian
Immigrants from Ukraine
Divorced or Separated
Divorced or Separated Comparison
Scandinavians
Immigrants from Ukraine
12.3%
DIVORCED OR SEPARATED
10.4/ 100
METRIC RATING
223rd/ 347
METRIC RANK
11.6%
DIVORCED OR SEPARATED
98.7/ 100
METRIC RATING
96th/ 347
METRIC RANK
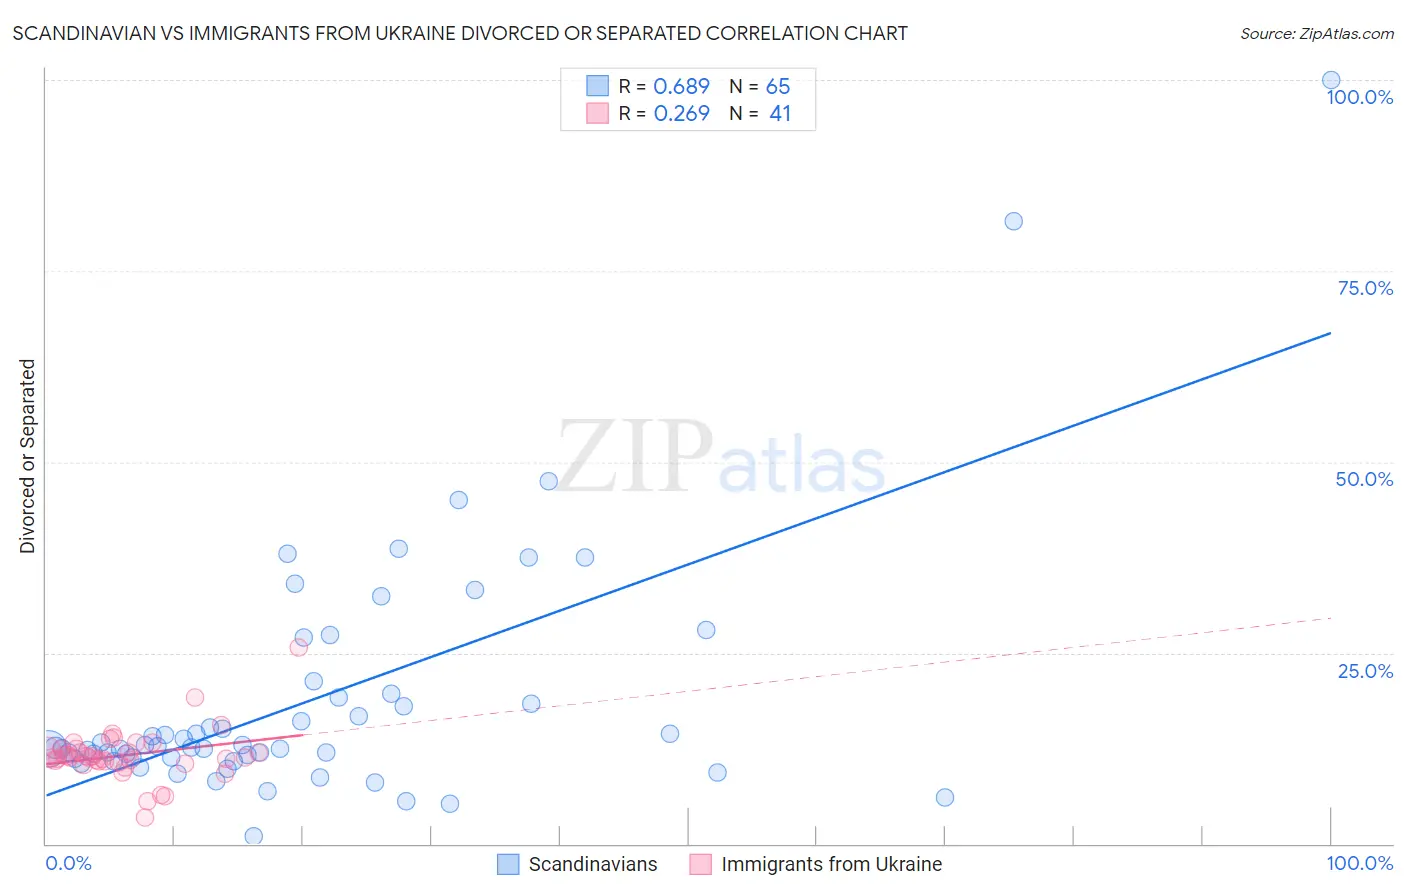
Scandinavian vs Immigrants from Ukraine Divorced or Separated Correlation Chart
The statistical analysis conducted on geographies consisting of 472,421,001 people shows a significant positive correlation between the proportion of Scandinavians and percentage of population currently divorced or separated in the United States with a correlation coefficient (R) of 0.689 and weighted average of 12.3%. Similarly, the statistical analysis conducted on geographies consisting of 289,638,825 people shows a weak positive correlation between the proportion of Immigrants from Ukraine and percentage of population currently divorced or separated in the United States with a correlation coefficient (R) of 0.269 and weighted average of 11.6%, a difference of 5.9%.
Divorced or Separated Correlation Summary
| Measurement | Scandinavian | Immigrants from Ukraine |
| Minimum | 1.0% | 3.5% |
| Maximum | 100.0% | 25.7% |
| Range | 99.0% | 22.2% |
| Mean | 18.9% | 11.6% |
| Median | 12.6% | 11.3% |
| Interquartile 25% (IQ1) | 11.2% | 10.7% |
| Interquartile 75% (IQ3) | 19.4% | 12.4% |
| Interquartile Range (IQR) | 8.2% | 1.7% |
| Standard Deviation (Sample) | 16.4% | 3.5% |
| Standard Deviation (Population) | 16.3% | 3.4% |
Similar Demographics by Divorced or Separated
Demographics Similar to Scandinavians by Divorced or Separated
In terms of divorced or separated, the demographic groups most similar to Scandinavians are Bangladeshi (12.3%, a difference of 0.010%), Immigrants from the Azores (12.3%, a difference of 0.070%), Belgian (12.3%, a difference of 0.070%), Guamanian/Chamorro (12.3%, a difference of 0.080%), and Immigrants from Western Africa (12.3%, a difference of 0.10%).
| Demographics | Rating | Rank | Divorced or Separated |
| Immigrants | South America | 15.4 /100 | #216 | Poor 12.2% |
| Northern Europeans | 14.7 /100 | #217 | Poor 12.2% |
| Slovenes | 13.2 /100 | #218 | Poor 12.3% |
| Czechoslovakians | 11.7 /100 | #219 | Poor 12.3% |
| British | 11.6 /100 | #220 | Poor 12.3% |
| Guamanians/Chamorros | 11.3 /100 | #221 | Poor 12.3% |
| Bangladeshis | 10.5 /100 | #222 | Poor 12.3% |
| Scandinavians | 10.4 /100 | #223 | Poor 12.3% |
| Immigrants | Azores | 9.7 /100 | #224 | Tragic 12.3% |
| Belgians | 9.7 /100 | #225 | Tragic 12.3% |
| Immigrants | Western Africa | 9.3 /100 | #226 | Tragic 12.3% |
| Hmong | 8.8 /100 | #227 | Tragic 12.3% |
| Immigrants | Cameroon | 8.3 /100 | #228 | Tragic 12.3% |
| Immigrants | Sudan | 8.2 /100 | #229 | Tragic 12.3% |
| Yakama | 7.8 /100 | #230 | Tragic 12.3% |
Demographics Similar to Immigrants from Ukraine by Divorced or Separated
In terms of divorced or separated, the demographic groups most similar to Immigrants from Ukraine are Immigrants from Serbia (11.6%, a difference of 0.020%), Latvian (11.6%, a difference of 0.030%), Immigrants from Jordan (11.6%, a difference of 0.060%), Immigrants from Sweden (11.6%, a difference of 0.080%), and Immigrants from Northern Europe (11.6%, a difference of 0.11%).
| Demographics | Rating | Rank | Divorced or Separated |
| Immigrants | Southern Europe | 99.1 /100 | #89 | Exceptional 11.6% |
| Zimbabweans | 99.0 /100 | #90 | Exceptional 11.6% |
| Spanish American Indians | 99.0 /100 | #91 | Exceptional 11.6% |
| Immigrants | Denmark | 98.9 /100 | #92 | Exceptional 11.6% |
| Arabs | 98.9 /100 | #93 | Exceptional 11.6% |
| Immigrants | Fiji | 98.9 /100 | #94 | Exceptional 11.6% |
| Immigrants | Serbia | 98.8 /100 | #95 | Exceptional 11.6% |
| Immigrants | Ukraine | 98.7 /100 | #96 | Exceptional 11.6% |
| Latvians | 98.7 /100 | #97 | Exceptional 11.6% |
| Immigrants | Jordan | 98.6 /100 | #98 | Exceptional 11.6% |
| Immigrants | Sweden | 98.6 /100 | #99 | Exceptional 11.6% |
| Immigrants | Northern Europe | 98.6 /100 | #100 | Exceptional 11.6% |
| Immigrants | Guyana | 98.5 /100 | #101 | Exceptional 11.6% |
| Immigrants | Croatia | 98.3 /100 | #102 | Exceptional 11.6% |
| Maltese | 98.2 /100 | #103 | Exceptional 11.6% |