Salvadoran vs Immigrants from Morocco Average Family Size
COMPARE
Salvadoran
Immigrants from Morocco
Average Family Size
Average Family Size Comparison
Salvadorans
Immigrants from Morocco
3.48
AVERAGE FAMILY SIZE
100.0/ 100
METRIC RATING
18th/ 347
METRIC RANK
3.21
AVERAGE FAMILY SIZE
18.5/ 100
METRIC RATING
201st/ 347
METRIC RANK
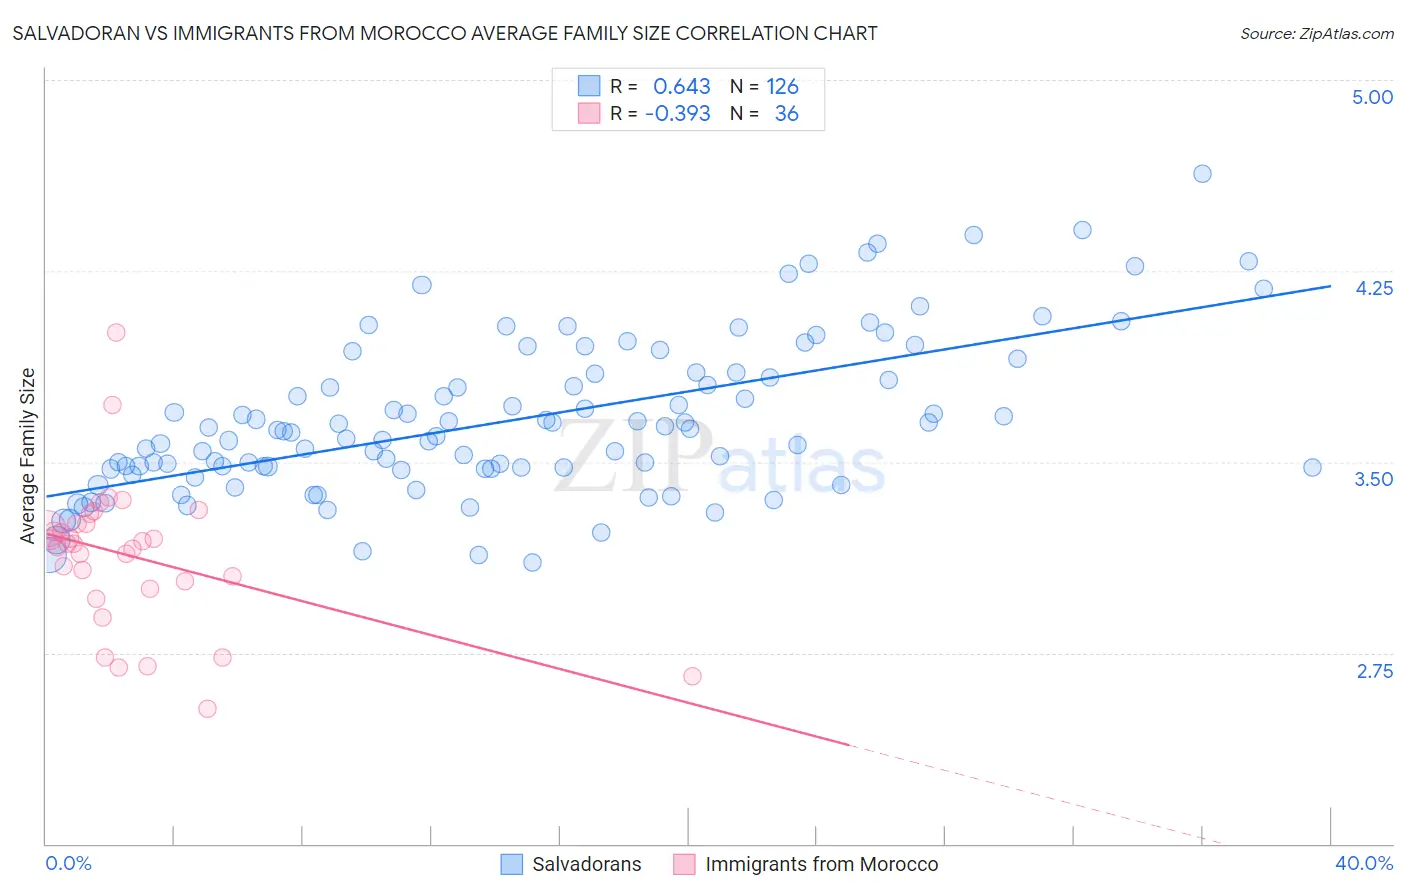
Salvadoran vs Immigrants from Morocco Average Family Size Correlation Chart
The statistical analysis conducted on geographies consisting of 398,698,929 people shows a significant positive correlation between the proportion of Salvadorans and average family size in the United States with a correlation coefficient (R) of 0.643 and weighted average of 3.48. Similarly, the statistical analysis conducted on geographies consisting of 178,909,598 people shows a mild negative correlation between the proportion of Immigrants from Morocco and average family size in the United States with a correlation coefficient (R) of -0.393 and weighted average of 3.21, a difference of 8.5%.
Average Family Size Correlation Summary
| Measurement | Salvadoran | Immigrants from Morocco |
| Minimum | 3.10 | 2.53 |
| Maximum | 4.63 | 4.01 |
| Range | 1.53 | 1.48 |
| Mean | 3.67 | 3.13 |
| Median | 3.62 | 3.18 |
| Interquartile 25% (IQ1) | 3.47 | 3.02 |
| Interquartile 75% (IQ3) | 3.85 | 3.26 |
| Interquartile Range (IQR) | 0.37 | 0.24 |
| Standard Deviation (Sample) | 0.31 | 0.29 |
| Standard Deviation (Population) | 0.31 | 0.28 |
Similar Demographics by Average Family Size
Demographics Similar to Salvadorans by Average Family Size
In terms of average family size, the demographic groups most similar to Salvadorans are Mexican (3.48, a difference of 0.070%), Cheyenne (3.47, a difference of 0.11%), Immigrants from El Salvador (3.49, a difference of 0.25%), Ute (3.49, a difference of 0.34%), and Yuman (3.47, a difference of 0.36%).
| Demographics | Rating | Rank | Average Family Size |
| Tohono O'odham | 100.0 /100 | #11 | Exceptional 3.53 |
| Immigrants | Mexico | 100.0 /100 | #12 | Exceptional 3.52 |
| Sioux | 100.0 /100 | #13 | Exceptional 3.52 |
| Immigrants | Central America | 100.0 /100 | #14 | Exceptional 3.49 |
| Tongans | 100.0 /100 | #15 | Exceptional 3.49 |
| Ute | 100.0 /100 | #16 | Exceptional 3.49 |
| Immigrants | El Salvador | 100.0 /100 | #17 | Exceptional 3.49 |
| Salvadorans | 100.0 /100 | #18 | Exceptional 3.48 |
| Mexicans | 100.0 /100 | #19 | Exceptional 3.48 |
| Cheyenne | 100.0 /100 | #20 | Exceptional 3.47 |
| Yuman | 100.0 /100 | #21 | Exceptional 3.47 |
| Apache | 100.0 /100 | #22 | Exceptional 3.46 |
| Immigrants | Fiji | 100.0 /100 | #23 | Exceptional 3.45 |
| Natives/Alaskans | 100.0 /100 | #24 | Exceptional 3.45 |
| Yakama | 100.0 /100 | #25 | Exceptional 3.45 |
Demographics Similar to Immigrants from Morocco by Average Family Size
In terms of average family size, the demographic groups most similar to Immigrants from Morocco are Immigrants from India (3.21, a difference of 0.0%), Immigrants from Nepal (3.21, a difference of 0.010%), Immigrants from Kenya (3.21, a difference of 0.020%), Hmong (3.21, a difference of 0.060%), and Immigrants from Poland (3.20, a difference of 0.060%).
| Demographics | Rating | Rank | Average Family Size |
| Immigrants | Sudan | 29.1 /100 | #194 | Fair 3.22 |
| Choctaw | 28.3 /100 | #195 | Fair 3.21 |
| Senegalese | 28.2 /100 | #196 | Fair 3.21 |
| Kenyans | 28.0 /100 | #197 | Fair 3.21 |
| Immigrants | Azores | 21.7 /100 | #198 | Fair 3.21 |
| Hmong | 20.7 /100 | #199 | Fair 3.21 |
| Immigrants | Kenya | 19.2 /100 | #200 | Poor 3.21 |
| Immigrants | Morocco | 18.5 /100 | #201 | Poor 3.21 |
| Immigrants | India | 18.5 /100 | #202 | Poor 3.21 |
| Immigrants | Nepal | 18.1 /100 | #203 | Poor 3.21 |
| Immigrants | Poland | 16.6 /100 | #204 | Poor 3.20 |
| Paraguayans | 16.3 /100 | #205 | Poor 3.20 |
| Immigrants | Cabo Verde | 16.0 /100 | #206 | Poor 3.20 |
| Filipinos | 13.6 /100 | #207 | Poor 3.20 |
| Chippewa | 13.3 /100 | #208 | Poor 3.20 |