French vs Immigrants from Morocco Average Family Size
COMPARE
French
Immigrants from Morocco
Average Family Size
Average Family Size Comparison
French
Immigrants from Morocco
3.10
AVERAGE FAMILY SIZE
0.0/ 100
METRIC RATING
338th/ 347
METRIC RANK
3.21
AVERAGE FAMILY SIZE
18.5/ 100
METRIC RATING
201st/ 347
METRIC RANK
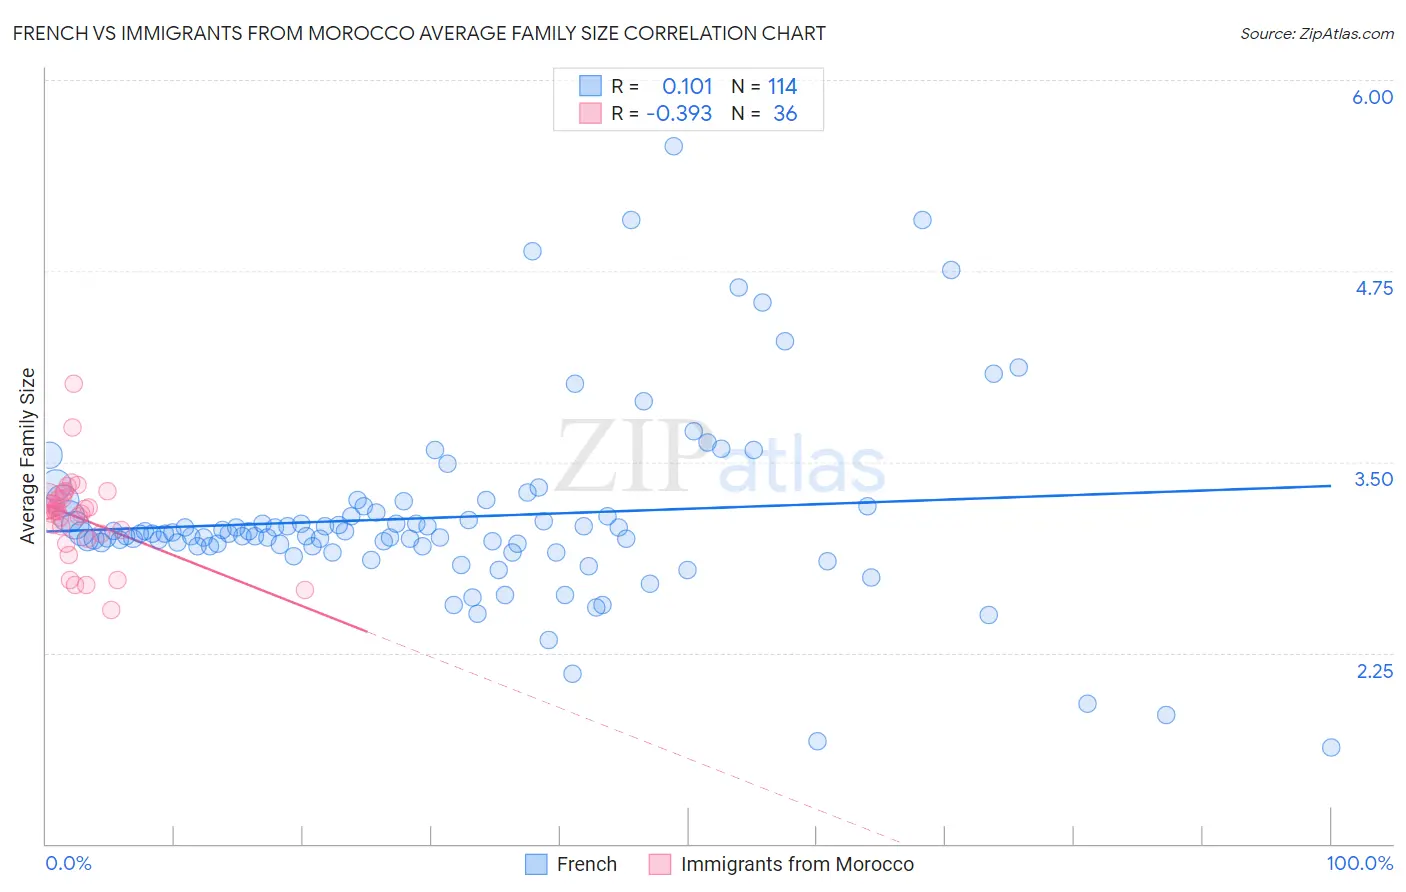
French vs Immigrants from Morocco Average Family Size Correlation Chart
The statistical analysis conducted on geographies consisting of 571,815,188 people shows a poor positive correlation between the proportion of French and average family size in the United States with a correlation coefficient (R) of 0.101 and weighted average of 3.10. Similarly, the statistical analysis conducted on geographies consisting of 178,909,598 people shows a mild negative correlation between the proportion of Immigrants from Morocco and average family size in the United States with a correlation coefficient (R) of -0.393 and weighted average of 3.21, a difference of 3.5%.
Average Family Size Correlation Summary
| Measurement | French | Immigrants from Morocco |
| Minimum | 1.63 | 2.53 |
| Maximum | 5.57 | 4.01 |
| Range | 3.94 | 1.48 |
| Mean | 3.14 | 3.13 |
| Median | 3.03 | 3.18 |
| Interquartile 25% (IQ1) | 2.95 | 3.02 |
| Interquartile 75% (IQ3) | 3.17 | 3.26 |
| Interquartile Range (IQR) | 0.22 | 0.24 |
| Standard Deviation (Sample) | 0.62 | 0.29 |
| Standard Deviation (Population) | 0.62 | 0.28 |
Similar Demographics by Average Family Size
Demographics Similar to French by Average Family Size
In terms of average family size, the demographic groups most similar to French are Croatian (3.10, a difference of 0.010%), Swedish (3.10, a difference of 0.020%), Irish (3.10, a difference of 0.060%), Luxembourger (3.10, a difference of 0.12%), and Estonian (3.10, a difference of 0.15%).
| Demographics | Rating | Rank | Average Family Size |
| Scotch-Irish | 0.0 /100 | #331 | Tragic 3.11 |
| Scottish | 0.0 /100 | #332 | Tragic 3.11 |
| Estonians | 0.0 /100 | #333 | Tragic 3.10 |
| Lithuanians | 0.0 /100 | #334 | Tragic 3.10 |
| Luxembourgers | 0.0 /100 | #335 | Tragic 3.10 |
| Irish | 0.0 /100 | #336 | Tragic 3.10 |
| Swedes | 0.0 /100 | #337 | Tragic 3.10 |
| French | 0.0 /100 | #338 | Tragic 3.10 |
| Croatians | 0.0 /100 | #339 | Tragic 3.10 |
| Finns | 0.0 /100 | #340 | Tragic 3.09 |
| Poles | 0.0 /100 | #341 | Tragic 3.09 |
| Germans | 0.0 /100 | #342 | Tragic 3.09 |
| Norwegians | 0.0 /100 | #343 | Tragic 3.08 |
| French Canadians | 0.0 /100 | #344 | Tragic 3.07 |
| Slovenes | 0.0 /100 | #345 | Tragic 3.07 |
Demographics Similar to Immigrants from Morocco by Average Family Size
In terms of average family size, the demographic groups most similar to Immigrants from Morocco are Immigrants from India (3.21, a difference of 0.0%), Immigrants from Nepal (3.21, a difference of 0.010%), Immigrants from Kenya (3.21, a difference of 0.020%), Hmong (3.21, a difference of 0.060%), and Immigrants from Poland (3.20, a difference of 0.060%).
| Demographics | Rating | Rank | Average Family Size |
| Immigrants | Sudan | 29.1 /100 | #194 | Fair 3.22 |
| Choctaw | 28.3 /100 | #195 | Fair 3.21 |
| Senegalese | 28.2 /100 | #196 | Fair 3.21 |
| Kenyans | 28.0 /100 | #197 | Fair 3.21 |
| Immigrants | Azores | 21.7 /100 | #198 | Fair 3.21 |
| Hmong | 20.7 /100 | #199 | Fair 3.21 |
| Immigrants | Kenya | 19.2 /100 | #200 | Poor 3.21 |
| Immigrants | Morocco | 18.5 /100 | #201 | Poor 3.21 |
| Immigrants | India | 18.5 /100 | #202 | Poor 3.21 |
| Immigrants | Nepal | 18.1 /100 | #203 | Poor 3.21 |
| Immigrants | Poland | 16.6 /100 | #204 | Poor 3.20 |
| Paraguayans | 16.3 /100 | #205 | Poor 3.20 |
| Immigrants | Cabo Verde | 16.0 /100 | #206 | Poor 3.20 |
| Filipinos | 13.6 /100 | #207 | Poor 3.20 |
| Chippewa | 13.3 /100 | #208 | Poor 3.20 |