Samoan vs Immigrants from Uruguay Births to Unmarried Women
COMPARE
Samoan
Immigrants from Uruguay
Births to Unmarried Women
Births to Unmarried Women Comparison
Samoans
Immigrants from Uruguay
32.6%
BIRTHS TO UNMARRIED WOMEN
21.9/ 100
METRIC RATING
195th/ 347
METRIC RANK
33.9%
BIRTHS TO UNMARRIED WOMEN
4.8/ 100
METRIC RATING
222nd/ 347
METRIC RANK
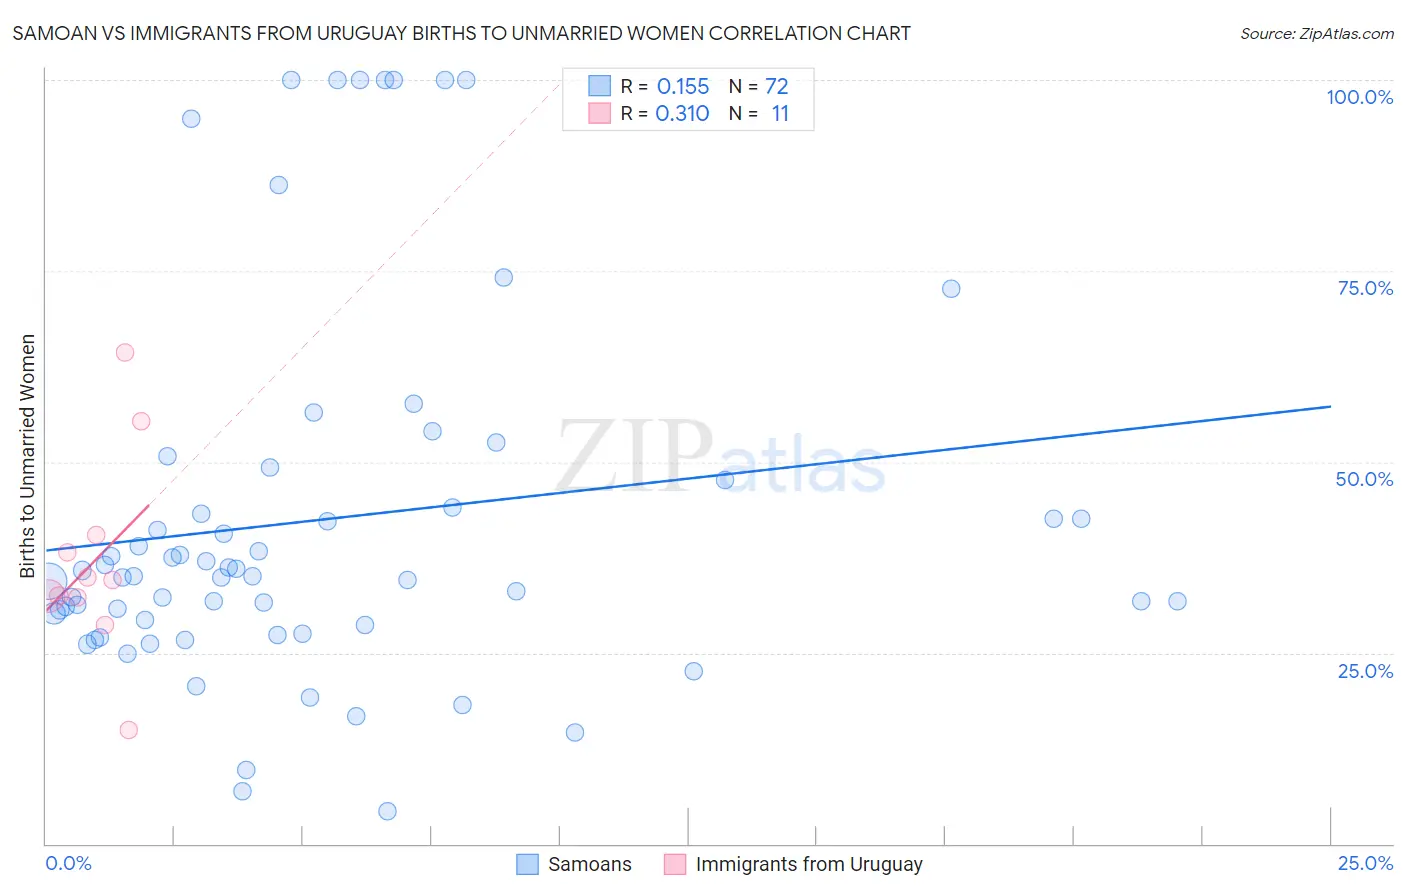
Samoan vs Immigrants from Uruguay Births to Unmarried Women Correlation Chart
The statistical analysis conducted on geographies consisting of 217,867,082 people shows a poor positive correlation between the proportion of Samoans and percentage of births to unmarried women in the United States with a correlation coefficient (R) of 0.155 and weighted average of 32.6%. Similarly, the statistical analysis conducted on geographies consisting of 129,349,421 people shows a mild positive correlation between the proportion of Immigrants from Uruguay and percentage of births to unmarried women in the United States with a correlation coefficient (R) of 0.310 and weighted average of 33.9%, a difference of 3.9%.
Births to Unmarried Women Correlation Summary
| Measurement | Samoan | Immigrants from Uruguay |
| Minimum | 4.3% | 14.9% |
| Maximum | 100.0% | 64.3% |
| Range | 95.7% | 49.4% |
| Mean | 42.4% | 37.1% |
| Median | 35.0% | 34.5% |
| Interquartile 25% (IQ1) | 28.9% | 32.2% |
| Interquartile 75% (IQ3) | 45.8% | 40.5% |
| Interquartile Range (IQR) | 16.9% | 8.2% |
| Standard Deviation (Sample) | 24.4% | 13.1% |
| Standard Deviation (Population) | 24.2% | 12.5% |
Similar Demographics by Births to Unmarried Women
Demographics Similar to Samoans by Births to Unmarried Women
In terms of births to unmarried women, the demographic groups most similar to Samoans are Immigrants from Colombia (32.6%, a difference of 0.030%), Immigrants (32.7%, a difference of 0.18%), Costa Rican (32.7%, a difference of 0.23%), Immigrants from Thailand (32.8%, a difference of 0.43%), and Immigrants from Germany (32.8%, a difference of 0.44%).
| Demographics | Rating | Rank | Births to Unmarried Women |
| Osage | 37.1 /100 | #188 | Fair 32.1% |
| Immigrants | Kenya | 36.9 /100 | #189 | Fair 32.1% |
| Tlingit-Haida | 32.6 /100 | #190 | Fair 32.2% |
| Irish | 32.4 /100 | #191 | Fair 32.2% |
| Colombians | 31.9 /100 | #192 | Fair 32.2% |
| Fijians | 31.1 /100 | #193 | Fair 32.3% |
| Sudanese | 27.3 /100 | #194 | Fair 32.4% |
| Samoans | 21.9 /100 | #195 | Fair 32.6% |
| Immigrants | Colombia | 21.7 /100 | #196 | Fair 32.6% |
| Immigrants | Immigrants | 20.6 /100 | #197 | Fair 32.7% |
| Costa Ricans | 20.3 /100 | #198 | Fair 32.7% |
| Immigrants | Thailand | 18.9 /100 | #199 | Poor 32.8% |
| Immigrants | Germany | 18.8 /100 | #200 | Poor 32.8% |
| Immigrants | Burma/Myanmar | 16.7 /100 | #201 | Poor 32.9% |
| Immigrants | Micronesia | 16.6 /100 | #202 | Poor 32.9% |
Demographics Similar to Immigrants from Uruguay by Births to Unmarried Women
In terms of births to unmarried women, the demographic groups most similar to Immigrants from Uruguay are Malaysian (33.9%, a difference of 0.060%), Portuguese (33.8%, a difference of 0.24%), Alsatian (33.8%, a difference of 0.26%), Pennsylvania German (34.0%, a difference of 0.29%), and Immigrants from Laos (34.0%, a difference of 0.29%).
| Demographics | Rating | Rank | Births to Unmarried Women |
| French | 8.7 /100 | #215 | Tragic 33.4% |
| Nepalese | 7.8 /100 | #216 | Tragic 33.5% |
| Spaniards | 7.0 /100 | #217 | Tragic 33.6% |
| Immigrants | Ecuador | 5.9 /100 | #218 | Tragic 33.7% |
| Alsatians | 5.4 /100 | #219 | Tragic 33.8% |
| Portuguese | 5.4 /100 | #220 | Tragic 33.8% |
| Malaysians | 5.0 /100 | #221 | Tragic 33.9% |
| Immigrants | Uruguay | 4.8 /100 | #222 | Tragic 33.9% |
| Pennsylvania Germans | 4.3 /100 | #223 | Tragic 34.0% |
| Immigrants | Laos | 4.3 /100 | #224 | Tragic 34.0% |
| Spanish | 4.0 /100 | #225 | Tragic 34.1% |
| Delaware | 3.3 /100 | #226 | Tragic 34.2% |
| Immigrants | Panama | 3.3 /100 | #227 | Tragic 34.2% |
| Panamanians | 3.3 /100 | #228 | Tragic 34.2% |
| Immigrants | Sierra Leone | 3.1 /100 | #229 | Tragic 34.2% |