Samoan vs Ghanaian Divorced or Separated
COMPARE
Samoan
Ghanaian
Divorced or Separated
Divorced or Separated Comparison
Samoans
Ghanaians
12.0%
DIVORCED OR SEPARATED
64.3/ 100
METRIC RATING
162nd/ 347
METRIC RANK
12.1%
DIVORCED OR SEPARATED
45.9/ 100
METRIC RATING
178th/ 347
METRIC RANK
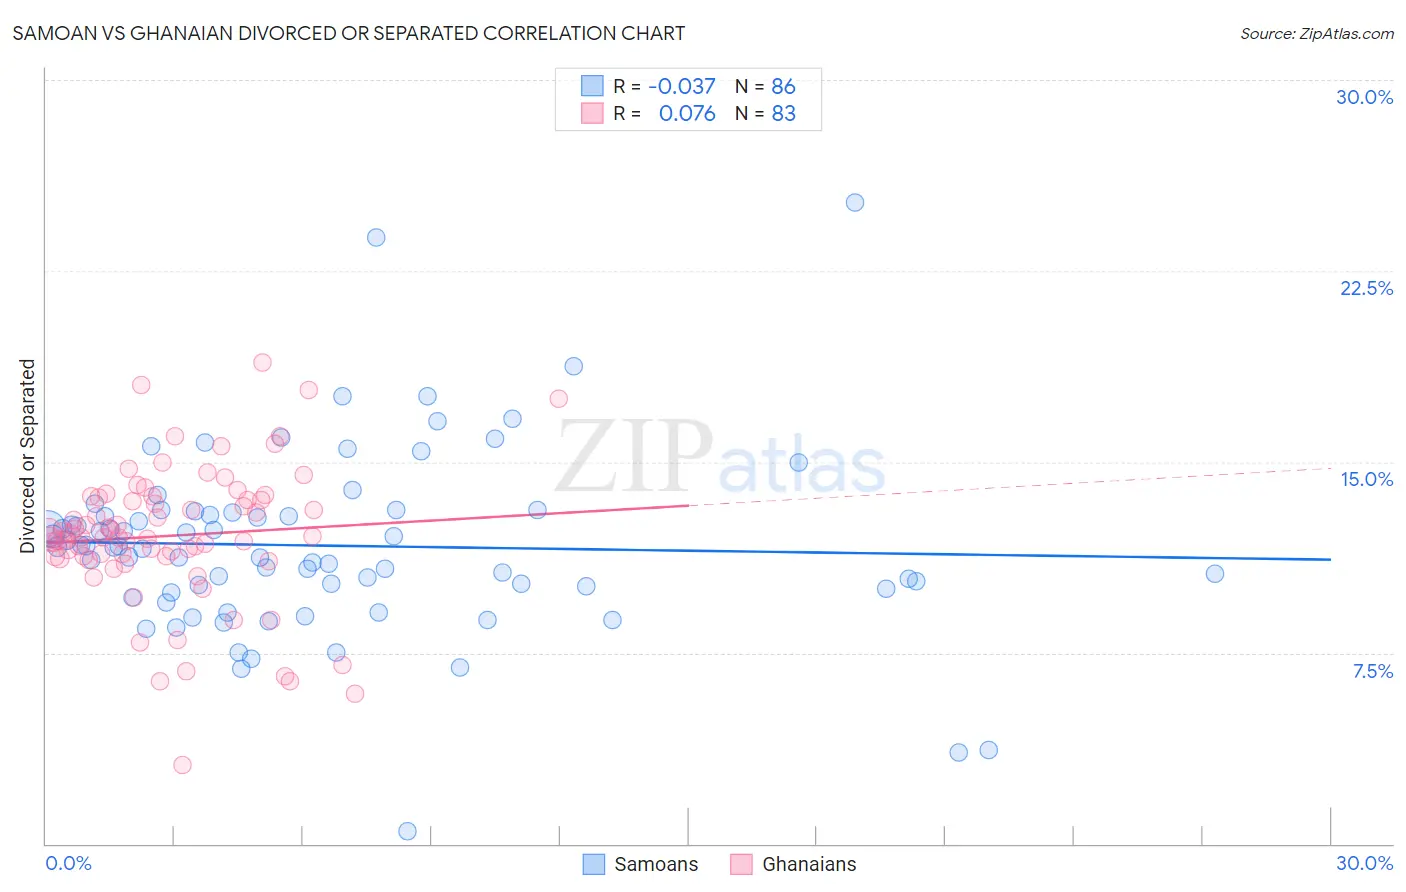
Samoan vs Ghanaian Divorced or Separated Correlation Chart
The statistical analysis conducted on geographies consisting of 225,171,159 people shows no correlation between the proportion of Samoans and percentage of population currently divorced or separated in the United States with a correlation coefficient (R) of -0.037 and weighted average of 12.0%. Similarly, the statistical analysis conducted on geographies consisting of 190,579,884 people shows a slight positive correlation between the proportion of Ghanaians and percentage of population currently divorced or separated in the United States with a correlation coefficient (R) of 0.076 and weighted average of 12.1%, a difference of 0.66%.
Divorced or Separated Correlation Summary
| Measurement | Samoan | Ghanaian |
| Minimum | 0.50% | 3.1% |
| Maximum | 25.2% | 18.9% |
| Range | 24.7% | 15.8% |
| Mean | 11.7% | 12.1% |
| Median | 11.7% | 12.1% |
| Interquartile 25% (IQ1) | 10.0% | 11.3% |
| Interquartile 75% (IQ3) | 13.0% | 13.6% |
| Interquartile Range (IQR) | 3.0% | 2.3% |
| Standard Deviation (Sample) | 3.6% | 2.7% |
| Standard Deviation (Population) | 3.6% | 2.7% |
Demographics Similar to Samoans and Ghanaians by Divorced or Separated
In terms of divorced or separated, the demographic groups most similar to Samoans are Marshallese (12.0%, a difference of 0.010%), Navajo (12.0%, a difference of 0.010%), Swiss (12.0%, a difference of 0.020%), Immigrants from Scotland (12.0%, a difference of 0.060%), and German Russian (12.0%, a difference of 0.090%). Similarly, the demographic groups most similar to Ghanaians are Immigrants from Western Europe (12.1%, a difference of 0.010%), Barbadian (12.1%, a difference of 0.030%), Brazilian (12.1%, a difference of 0.060%), Pennsylvania German (12.1%, a difference of 0.11%), and Hawaiian (12.1%, a difference of 0.14%).
| Demographics | Rating | Rank | Divorced or Separated |
| Immigrants | Scotland | 65.8 /100 | #160 | Good 12.0% |
| Marshallese | 64.6 /100 | #161 | Good 12.0% |
| Samoans | 64.3 /100 | #162 | Good 12.0% |
| Navajo | 63.9 /100 | #163 | Good 12.0% |
| Swiss | 63.6 /100 | #164 | Good 12.0% |
| German Russians | 61.8 /100 | #165 | Good 12.0% |
| Tohono O'odham | 60.4 /100 | #166 | Good 12.0% |
| Ethiopians | 58.5 /100 | #167 | Average 12.0% |
| Serbians | 57.1 /100 | #168 | Average 12.0% |
| Immigrants | Peru | 57.0 /100 | #169 | Average 12.0% |
| Mexican American Indians | 55.8 /100 | #170 | Average 12.0% |
| Costa Ricans | 53.3 /100 | #171 | Average 12.0% |
| Immigrants | Mexico | 53.2 /100 | #172 | Average 12.0% |
| Immigrants | Moldova | 50.4 /100 | #173 | Average 12.1% |
| Hawaiians | 50.0 /100 | #174 | Average 12.1% |
| Immigrants | Sierra Leone | 50.0 /100 | #175 | Average 12.1% |
| Pennsylvania Germans | 48.9 /100 | #176 | Average 12.1% |
| Brazilians | 47.7 /100 | #177 | Average 12.1% |
| Ghanaians | 45.9 /100 | #178 | Average 12.1% |
| Immigrants | Western Europe | 45.6 /100 | #179 | Average 12.1% |
| Barbadians | 45.0 /100 | #180 | Average 12.1% |